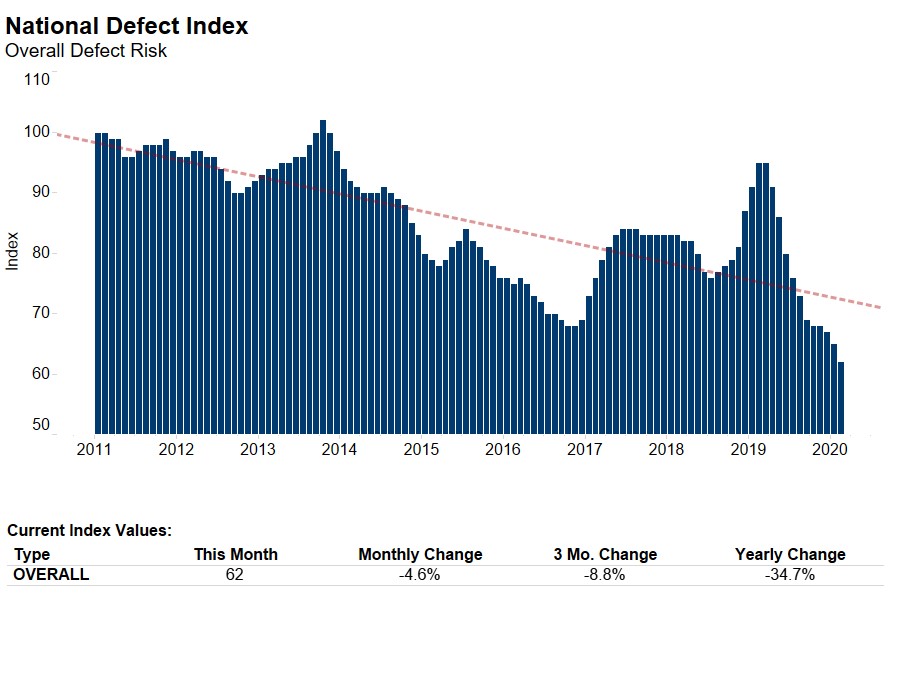
We’ve posted the November First American Loan Application Defect Index, which estimates the frequency of defects, fraudulence and misrepresentation in the information submitted in mortgage loan applications. The Defect Index remains the same as compared with the previous month, and increased 22.1 percent as compared with November 2016. The Defect Index is down 18.6 percent from the high point of risk in October 2013.
“In the spirit of the holiday season, we have created ‘naughty or nice’ lists for defect, fraud and misrepresentation risk. The states on the ‘naughty’ list had the greatest defect risk in November and the states on the ‘nice’ list had the least defect risk in November,” said Mark Fleming, chief economist at First American.
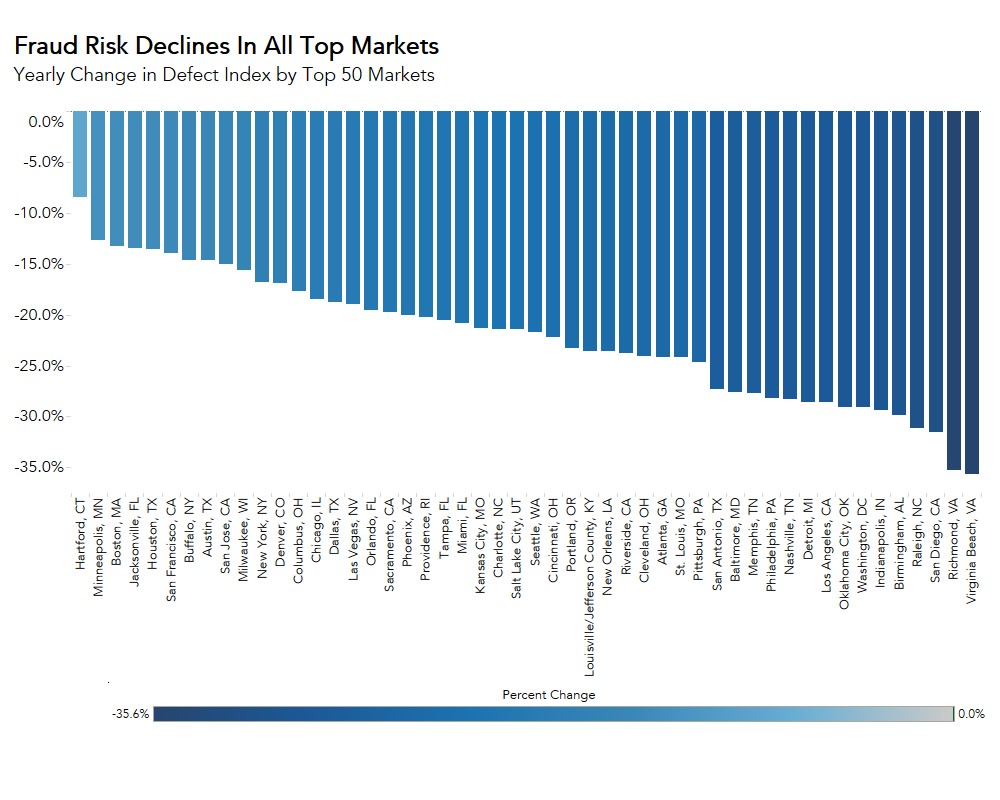
For the defect risk ‘naughty or nice’ lists, the top five states and markets where defect risk is increasing or decreasing, and more, please visit the Loan Application Defect Index.
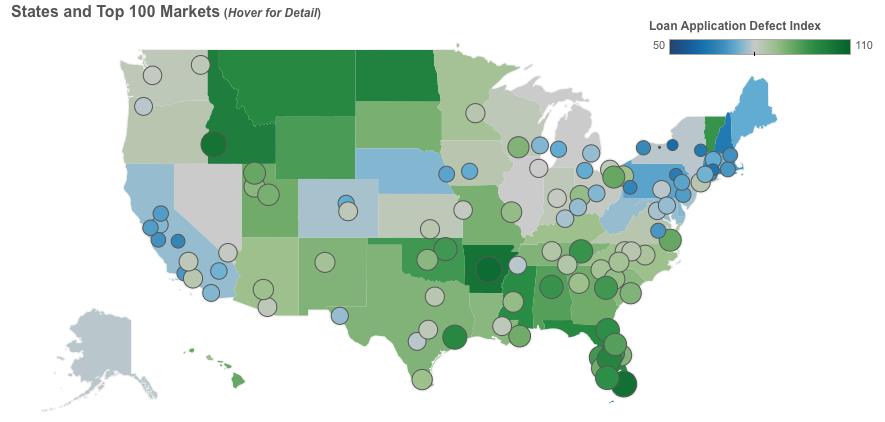
“As the Defect Index map shows, defect risk, or the lack thereof, is clearly concentrating regionally. The Northeast and California are generally low risk, while the South, Southeast and upper Midwest are generally higher risk,” added Fleming.