First American’s proprietary Potential Home Sales model examines June 2017 data and includes analysis from First American Chief Economist Mark Fleming on how the real estate market is performing versus its potential.
June 2017 Potential Home Sales
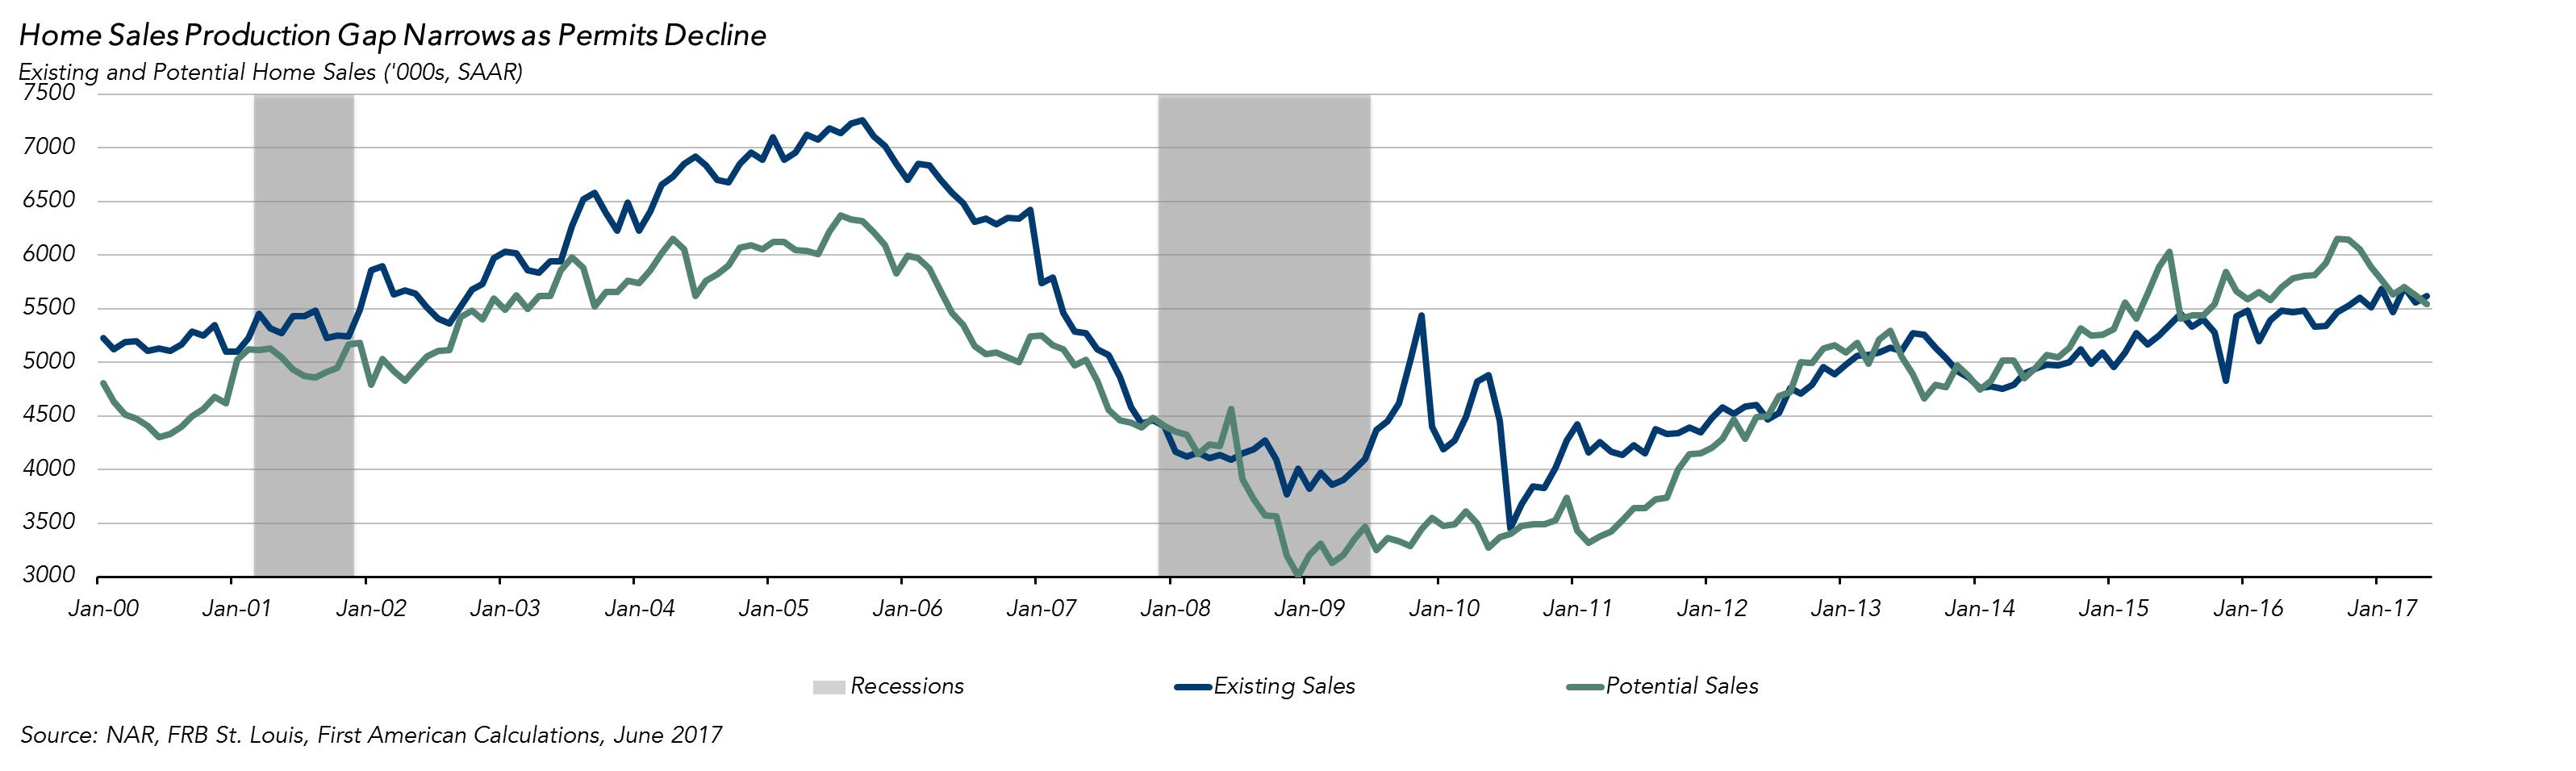
For the month of June, First American updated its proprietary Potential Home Sales model to show that:
- Potential existing-home sales increased to a 5.59 million seasonally adjusted, annualized rate (SAAR), a 0.8 percent month-over-month increase.
- This represents an 85.8 percent increase from the market potential low point reached in December 2008.
- In June, the market potential for existing-home sales fell by 3.8 percent compared with a year ago, a decline of 220,000 (SAAR) sales.
- Currently, potential existing-home sales is 780,000 (SAAR), or 14.0 percent below the pre-recession peak of market potential, which occurred in July 2005.
Market Performance Gap
- The market for existing-home sales is outperforming its potential by 0.6 percent or an estimated 31,000 (SAAR) sales.
- Market potential grew by an estimated 45,000 (SAAR) sales between May 2017 and June 2017.
Lack of Inventory Remains a Challenge and is Decreasing Affordability
Demand for homes continued to remain strong this month, largely due to continued demand from more Millennials deciding they want to be homeowners. Yet, the supply of homes for sale continues to decrease. Existing homeowners fear not being able to find something affordable to buy, and a lack of residential construction workers is increasing the cost of building and slowing the pace of new construction. The result is a supply and demand imbalance that produces upward pressure on house prices and decreasing affordability.
Chief Economist Analysis Highlights
- The housing market’s potential for existing-home sales improved slightly in June, growing 0.8 percent over the course of the month as the 30-year, fixed-rate mortgage rate fell to a six-month low of 3.9 percent.
- Inventory shortages continue to challenge the market. According to the National Association of Realtors (NAR), the inventory of existing-homes for sale in May is 8.4 percent lower than a year ago. This is the 24th consecutive month of year-over-year declines.
- Existing homeowners fear not being able to find something affordable to buy. This dilemma is imprisoning homeowners and causing inventory shortages in practically every market across the country.
- The decline in residential construction employment is dragging down housing starts, a critical source of housing supply. It’s very hard to increase housing starts without increasing residential construction employment.
- According to the US Census Bureau, permits for newly constructed houses, a leading indicator for housing starts, fell 4.9 percent between April and May. As new construction supply stalls, the market potential for home sales will also stall.
- In response to the combination of tight supply and high demand, house prices are rising at a brisk pace. According to the First American Real House Price Index, fast house price growth combined with mortgage rates that are higher than a year ago has impacted affordability, which is down 11 percent in May compared to a year ago.
When considering the right time to buy or sell a home, an important factor in the decision should be the market’s overall health, which is largely a function of supply and demand. Knowing how close the market is to a healthy level of activity can help consumers determine if it is a good time to buy or sell, and what might happen to the market in the future. That’s difficult to assess when looking at the number of homes sold at a particular point in time without understanding the health of the market at that time. Historical context is critically important. Our potential home sales model measures what we believe a healthy market level of home sales should be based on the economic, demographic, and housing market environments.
About the Potential Home Sales Model
Potential home sales measures existing-homes sales, which include single-family homes, townhomes, condominiums and co-ops on a seasonally adjusted annualized rate based on the historical relationship between existing-home sales and U.S. population demographic data, income and labor market conditions in the U.S. economy, price trends in the U.S. housing market, and conditions in the financial market. When the actual level of existing-home sales are significantly above potential home sales the pace of turnover is not supported by market fundamentals and there is an increased likelihood of a market correction. Conversely, seasonally adjusted, annualized rates of actual existing-home sales below the level of potential existing-home sales indicate market turnover is underperforming the rate fundamentally supported by the current conditions. Actual seasonally adjusted, annualized existing-home sales may exceed or fall short of the potential rate of sales for a variety of reasons, including non-traditional market conditions, policy constraints and market participant behavior. Recent potential home sale estimates are subject to revision in order to reflect the most up-to-date information available on the economy, housing market and financial conditions. The Potential Home Sales model is published prior to the National Association of Realtors’ Existing-Home Sales report each month.


