For the month of August, First American’s proprietary Potential Home Sales model showed that the market for existing-home sales is underperforming its potential by 5.6 percent or an estimated 323,000 seasonally adjusted, annualized rate (SAAR) of sales, an improvement relative to last month’s revised performance gap of -5.7 percent or 328,000 (SAAR) sales. The Potential Home Sales model provides a measure of what a healthy market level of home sales should be based on Chief Economist Mark Fleming’s analysis of current economic and demographic factors and the dynamics of the housing market environment. In August, the market potential for existing-home sales grew by 1.08 percent compared to July, an increase of 62,000 (SAAR) sales, and increased by 5.9 percent compared to a year ago.
This month, potential existing-home sales increased to 5.78 million (SAAR). This represents a 91.9 percent increase from the market potential low point reached in December 2008*, however it is a decline of 371,000 (SAAR) or 6.4 percent from the pre-recession peak of market potential, which occurred in July 2005.
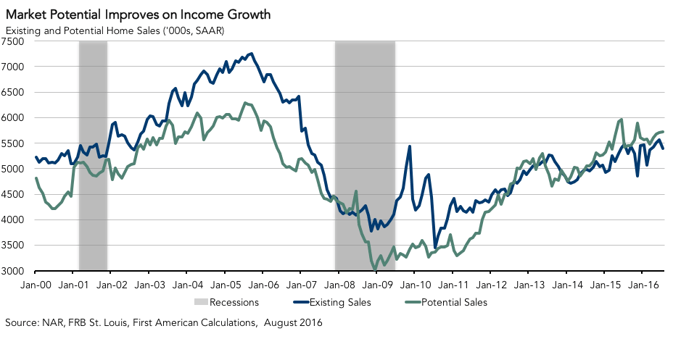
Analysis: Market Potential Improves on Income Growth
According to the National Association of Realtors (NAR), existing-home sales stumbled in July, falling to 5.39 million (SAAR) from 5.57 million (SAAR) sales in June. The 1.6 percent year-over year decrease is the first year-over-year decline since November 2015. Month-over-month, the drop was 3.2 percent, which is the first decline following three months of consecutive gains in the number of existing home sales. The West, which has recently been a laggard in sales when compared to other parts of the country, saw a 2.5 percent increase from June to July and was the only region to experience an increase in existing-home sales. The Northeast fell by 13.2 percent on a month-over-month basis, while the Midwest and South saw sales drop by 5.2 percent and 2.5 percent, respectively.
Low inventories still remain a significant issue, although the increase to a 4.7-month supply in July from a downwardly revised 4.5-month supply in June should offer some relief to frustrated potential homebuyers competing over the constrained supply. Low inventory levels continue to put upward pressure on home prices, which rose an estimated 6.1 percent year-over-year on a seasonally adjusted basis in July, according to the Case-Shiller House Price Index.
Despite tight inventories and rising prices, consumers continue to be optimistic about the housing market. Nowhere is this more evident than in new-home sales volume, which according to the U.S. Census Bureau, grew by 12.4 percent between June and July and 31.3 percent from the year prior. Furthermore, the share of new home sales under $300,000 grew to 52 percent in July up from 48 percent in June, indicating that not only are homebuilders adding much needed supply to the market, but they are doing so at the lower end of the price distribution with an eye on entry-level buyers.
"Recent improvements in employment and income levels are beneficial to housing demand, but increasing the pressure for an FOMC rate increase."
Historic low mortgage rates have been extremely influential in boosting the housing market, softening the impact of rising prices and offering consumers increased leverage and buoyed home-buying power. However, recent improvements in employment data and income gains are starting to play a larger role influencing home-buying power, providing a firm foundation for increased housing demand. According to the Bureau of Labor Statistics (employers added 151,000 jobs in August, which was slightly under expectations, holding the unemployment rate and participation rate unchanged at 4.9 percent and 62.8 percent, respectively. More importantly, average hourly earnings have continued moving upwards, changing 2.4 percent from a year prior to $25.73. Further confirming signs of a stronger consumer, the U.S. Census Bureau announced that real median household incomes increased by 5.2 percent between 2014 and 2015, the first annual increase in household incomes measured since 2007. The increases in household income were broad, with every demographic group seeing gains in income. However, the increases were greater for lower- and middle-income households. Real median household incomes for households in the 10th percentile of the income distribution saw their income rise by 7.9 percent in 2015 and households in the 20th percentile had their incomes grow by 6.3 percent, whereas households in the top 90th percentile experienced only a 2.9 percent gain.
These recent gains in consumer financial health not only impacts housing demand, but also play a role in the Federal Open Market Committee’s (FOMC) rate policy. With the September meeting just around the corner, some are now questioning if these positive economic indicators are enough for the Fed to raise rates. While the labor markets are improving and wages are rising, have the gains been strong enough to convince the FOMC that a rate hike is in order? Inflation, which is tracked by the FOMC using the core personal consumption expenditure (PCE) , reached 1.6 percent in June, just under the target of 2 percent. Will this news cause the policy makers to change course, or does it demand more patience? Will global economic uncertainty, paradoxically a key driver in keeping U.S. mortgage rates low, cause the committee members to pause and table a rate hike decision yet again? Rising rates will have a modest impact on housing demand, but they also signal a strengthening labor market and increased inflation pressure due to rising incomes – both unequivocally good for housing market health.
About the Potential Home Sales Model
When considering the right time to buy or sell a home, an important factor in the decision should be the market’s overall health, which is largely a function of supply and demand. Knowing how close the market is to a healthy level of activity can help consumers determine if it is a good time to buy or sell, and what might happen to the market in the future. That’s difficult to assess if potential buyers and sellers are only looking at the number of homes sold at a particular point in time. Historical context is critically important. The Potential Home Sales model provides a measure of what a healthy market level of home sales should be based on Chief Economist Mark Fleming’s analysis of current economic and demographic factors and the dynamics of the housing market environment. For example, at the height of the housing boom in 2006 home sales were approximately 7 million a year compared with about 3.5 million in 2011 after the first-time homebuyer tax credit expired.
Potential home sales measures existing-homes sales, which include single-family homes, townhomes, condominiums and co-ops on a seasonally adjusted annualized rate, based on the historical relationship between existing-home sales and U.S. population demographic data, income and labor market conditions in the U.S. economy, price trends in the U.S. housing market, and conditions in the financial market. When the actual level of existing-home sales are significantly above potential home sales, there is an increased likelihood of a market correction because the pace of turnover is not supported by market fundamentals. Conversely, seasonally adjusted, annualized rates of actual existing-home sales below the level of potential existing-home sales indicate market turnover is underperforming the rate fundamentally supported by the current conditions. Actual seasonally adjusted, annualized existing-home sales may exceed or fall short of the potential rate of sales for a variety of reasons, including non-traditional market conditions, policy constraints and market participant behavior. Recent potential home sale estimates are subject to revision in order to reflect the most up-to-date information available on the economy, housing market and financial conditions. The Potential Home Sales model will be published prior to the National Association of Realtors’ Existing-Home Sales report each month.


