First American Chief Economist Mark Fleming shares his proprietary Potential Home Sales model with analysis of housing market trends in January 2017.
January 2017 Potential Home Sales
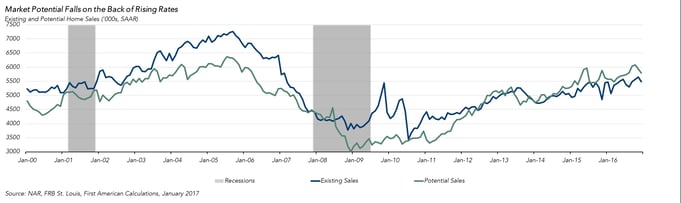
For the month of January, First American updated its proprietary Potential Home Sales model to show that:
- Potential existing-home sales decreased to a 5.5 million seasonally adjusted, annualized rate (SAAR).
- This represents an 81.7 percent increase from the market potential low point reached in December 2008.
- In January, the market potential for existing-home sales fell by 1.9 percent compared with a year ago, a decline of 107,000 (SAAR) sales.
- Currently, potential existing-home sales is 328,000 (SAAR) or 13.8 percent below the pre-recession peak of market potential, which occurred in July 2005.
Market Performance Gap
- The market for existing-home sales is underperforming its potential by 0.2 percent or an estimated 9,500 (SAAR) of sales, which is the smallest performance gap in the last 18 months.
- Last month’s revised underperformance gap was 2.0 percent or 117,000 (SAAR) sales.
Rising Mortgage Rates Lower Market Potential and Restrict Supply
“While higher mortgage rates did reduce the market’s potential, they also will have the positive effect of moderating house price appreciation,” said Mark Fleming, chief economist at First American. “More troubling is the lack of homes for sale, which is causing a ‘matching-trap’ where current homeowners are reluctant to sell because of concerns about the ability to find a home to buy and the likelihood that their new mortgage will have a higher rate than their existing mortgage.”
Chief Economist Analysis Highlights
- The housing market’s potential for existing-home sales fell 1.9 percent over the past twelve months, driven primarily by rising mortgage rates. The rising rates are influencing potential sellers to hold their properties off market and decreasing affordability, which modestly reduced first-time homebuyer demand.
- The low inventory of homes for sale, currently 3.6 months’ supply, continues to be a concern. Tight supply accompanied by rising prices is more indicative of a market reacting to a shift in the willingness of homeowners to list their homes for sale, and less indicative of a market reacting to a shortage of demand due to affordability issues. Restricted demand would result in lower quantity of homes for sale and lower, not higher, prices.
- The hesitation to sell is being caused by a “matching-trap.” Current homeowners are reluctant to list their homes for sale because they are concerned they will not find a home to buy.
- Additionally, higher interest rates discourage the decision to sell because even a new mortgage for an equal amount becomes more expensive in terms of monthly debt-service payments as rates rise.
What Insight Does the Potential Home Sales Model Reveal?
When considering the right time to buy or sell a home, an important factor in the decision should be the market’s overall health, which is largely a function of supply and demand. Knowing how close the market is to a healthy level of activity can help consumers determine if it is a good time to buy or sell, and what might happen to the market in the future. That’s difficult to assess when looking at the number of homes sold at a particular point in time without understanding the health of the market at that time. Historical context is critically important. Our potential home sales model measures what we believe a healthy market level of home sales should be based on the economic, demographic, and housing market environments.
About the Potential Home Sales Model
Potential home sales measures existing-homes sales, which include single-family homes, townhomes, condominiums and co-ops on a seasonally adjusted annualized rate based on the historical relationship between existing-home sales and U.S. population demographic data, income and labor market conditions in the U.S. economy, price trends in the U.S. housing market, and conditions in the financial market. When the actual level of existing-home sales are significantly above potential home sales the pace of turnover is not supported by market fundamentals and there is an increased likelihood of a market correction. Conversely, seasonally adjusted, annualized rates of actual existing-home sales below the level of potential existing-home sales indicate market turnover is underperforming the rate fundamentally supported by the current conditions. Actual seasonally adjusted, annualized existing-home sales may exceed or fall short of the potential rate of sales for a variety of reasons, including non-traditional market conditions, policy constraints and market participant behavior. Recent potential home sale estimates are subject to revision in order to reflect the most up-to-date information available on the economy, housing market and financial conditions. The Potential Home Sales model is published prior to the National Association of Realtors’ Existing-Home Sales report each month.


