Today, the Bureau of Labor Statistics released the employment situation report for March. Here are the headlines. Total non-farm payroll jobs increased by 103,000 in March. Total non-farm payroll jobs have increased every month since October 2010. Since that date, the U.S. economy has added more than 17.5 million jobs. The unemployment rate remained again unchanged at 4.1 percent, a 17-year low, and average hourly earnings are up 2.4 percent over a year ago for production and non-supervisory employees. While the number of jobs created may seem disappointing, the data continues to paint a positive picture of the economy, but those are not the numbers that really matter.
Last month, in my analysis of the employment situation report, I noted that wage growth often leads to rising household income levels, which increases consumer house-buying power. It’s pretty simple. Faster rising wages increases the pace of household income growth and improves consumer house-buying power. But, how do we know if wage growth is likely to continue? Is there an indicator we can monitor for insight?
"As more prime-age workers choose to enter the labor force, competition among firms increases, and wages will rise faster. 82.1 – the prime-age labor force participation rate. That’s the most important number to know this month."
Traditionally, many economists have relied on the Phillips curve. Created in 1958 by economist William Phillips, the Phillips curve describes the relationship between the unemployment rate and wage growth. As the unemployment rate goes down, wage growth goes up. This is important because the Fed uses the relationship to gauge the risk of rising inflation. Intuitively, the logic of the Phillips curve is that when unemployment is low, companies face greater competition for employees and offer higher wages to attract talent. Eventually, as wages rise, firms will have to pass some of those costs on to their customers, which should lead to higher inflation.
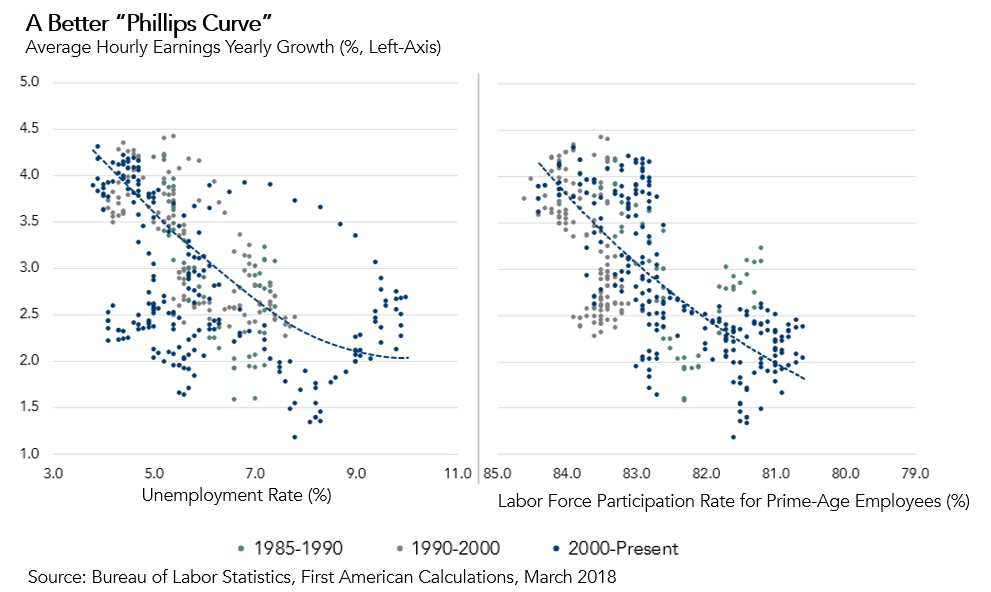
Yet, today, it seems that the Phillips curve relationship is broken (figure 1, left). We have a low – arguably very low – unemployment rate, but not nearly the level of production and non-supervisory employee wage growth that would be expected, 4.0 percent, according to the Phillips curve. Is it possible that the Phillips curve relationship between unemployment and wage growth (and by extension, inflation) no longer exists?
A stronger indicator in today’s economy of likely wage growth may be the prime-age labor force participation rate, which is the total number of employed and unemployed 25-54 year-olds as a share of the total number of 25-54 year-olds). As this participation rate rises, competition for workers increases and leads to higher wages (figure 1, right).

The prime-age labor force participation rate hit a post-recession low in September 2015. Since then, it has been rising steadily to its current level of 82.1 percent and is much closer to its pre-recession level. Given the current prime-age labor force participation rate, the re-configured “Phillips curve” indicates production and non-supervisory wage growth should be 2.62 percent. This is much closer to today’s reported growth rate of 2.4 percent. As more prime-age workers choose to enter the labor force, competition among firms increases, and wages will rise faster. 82.1 – the prime-age labor force participation rate. That’s the most important number to know this month.


