The housing market prior to the pandemic could have been characterized as a sellers’ market, with a shortage of supply relative to demand. With the current supply of homes for sale even tighter relative to demand, it can only be characterized as a super-sellers’ market today. The pandemic has intensified a sense of home as refuge and falling mortgage rates have made financing a home purchase historically inexpensive. As a result, demand for homes has surged while the supply of homes for sale has fallen to near record lows, resulting in rapid house price appreciation. Nominal house price appreciation was 7.9 percent higher in October than in March of this year, a precipitous rise in just seven months that has pushed back against the 10.7 percent increase in house-buying power over the same period.
“Will robust house-buying power be enough to offset the growth in nominal house price appreciation expected next year or will the trend of declining affordability continue?”
The good news is affordability has improved nationally by 2.5 percent since the start of the recession in March. In this month’s report, we dive deeper and examine how affordability trends have fared at the market level since March and, in particular, during the post stay-at-home-order super-sellers’ market of June to October.
Pandemic-Driven Decline in Affordability?
Mortgage rates are fairly consistent across the country, so when mortgage rates fall, they boost house-buying power and increase affordability in every city. However, the other components of the Real House Price Index (RHPI), household income levels and nominal house prices, vary market by market, so they do not have a uniform impact on affordability. During the initial months of the recession, from March through June, affordability improved because falling rates and rising incomes were enough to offset house price appreciation gains. However, as potential homebuyers emerged from the stay-at-home orders implemented early in the pandemic, the housing market began to heat up once more. Comparing the RHPI levels in October relative to the resurgence of home buyer interest in June, affordability declined in 24 of the top 50 markets we track.
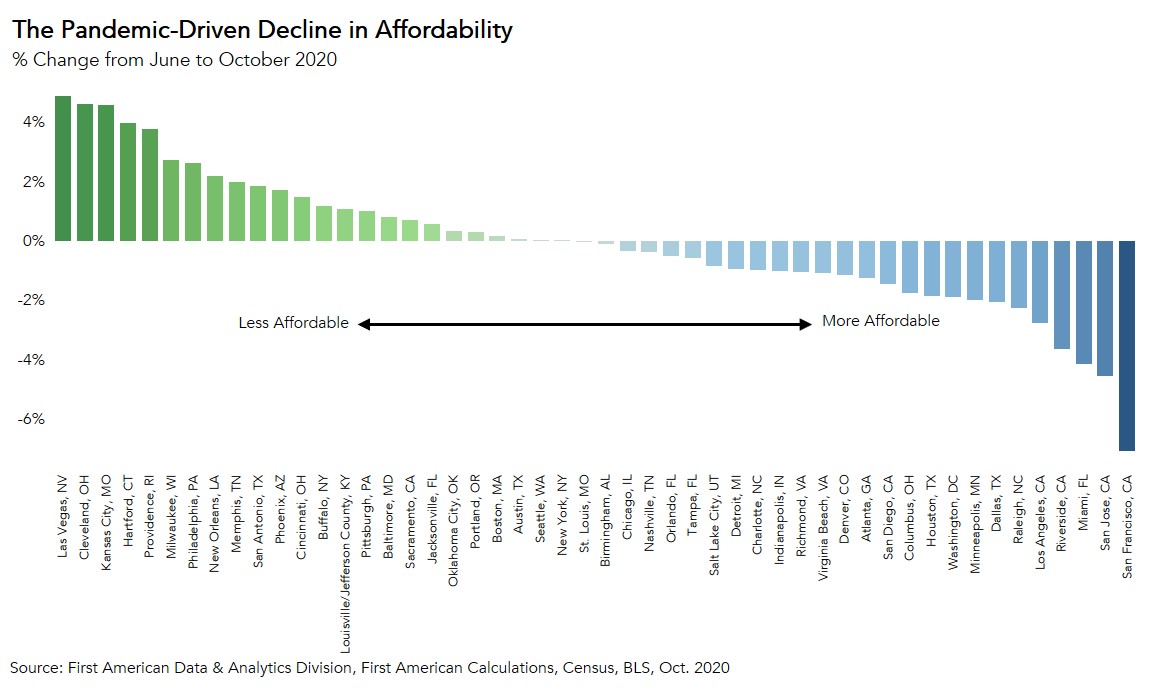
The five markets with the greatest decline in affordability since June were:
1. Las Vegas (-4.9 percent)
2. Cleveland (-4.6 percent)
3. Kansas City, Mo (-4.6 percent)
4. Hartford, Conn. (-4.0 percent)
5. Providence, R.I. (-3.8 percent)
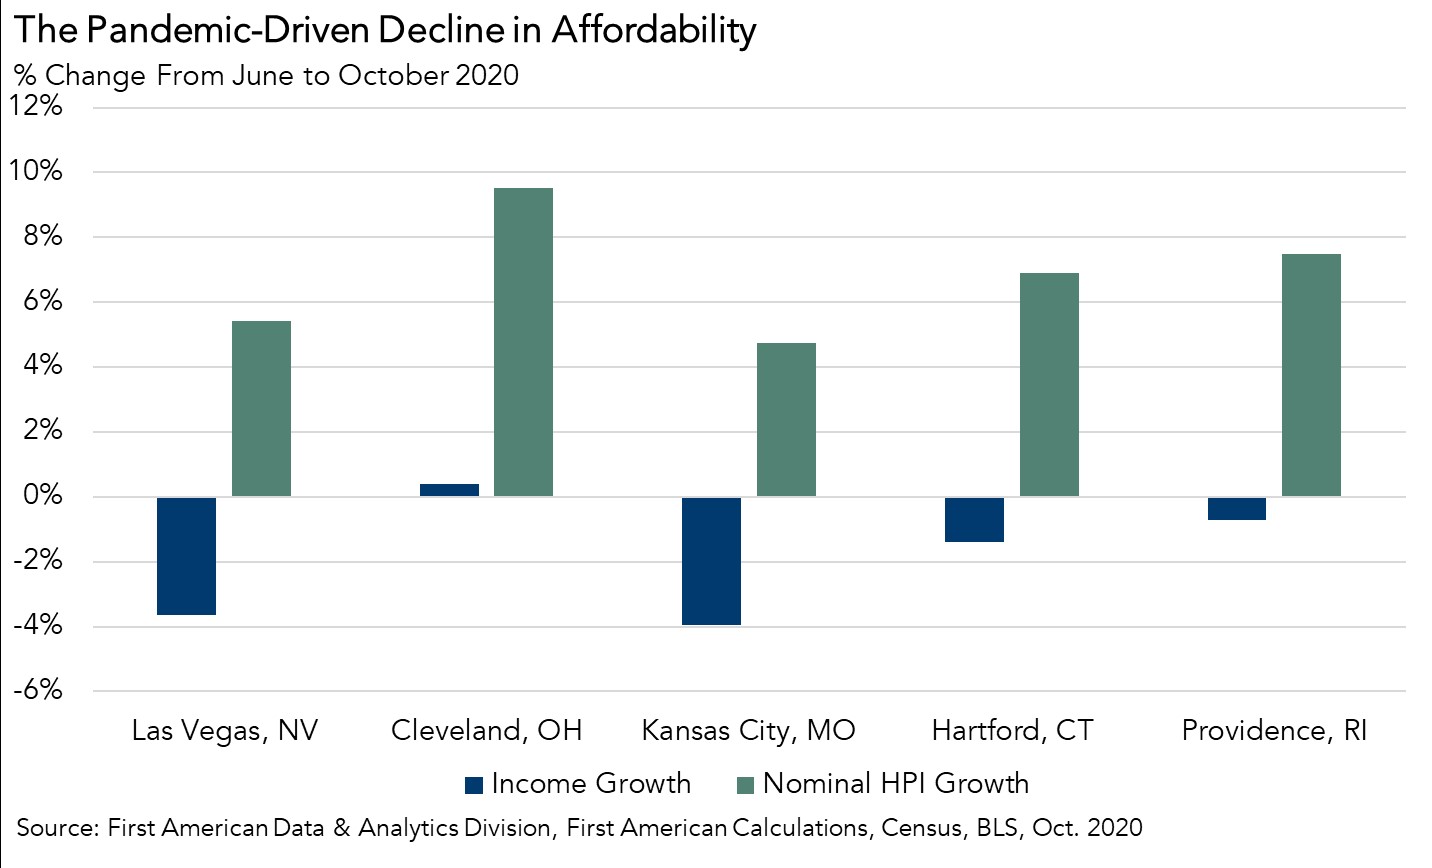
June marked a turning point in affordability trends for all five of these markets as affordability had actually improved in each market since the beginning of the recession in March, with affordability improving anywhere from 2.4 percent to 9 percent. However, the pent-up demand from spring came roaring back in June and the super-sellers’ market emerged. Between June and October, nominal house price appreciation exploded in all five markets and household income levels declined in each market, except Cleveland, due to the economic stresses of the recession. Even though the 30-year, fixed mortgage rate fell from 3.16 percent in June to 2.83 percent in October, the rate-driven boost to affordability was not enough to offset the affordability loss from faster house price appreciation and lower household income.
The Outlook for Affordability
Recent history has shown that in times of economic distress, lower mortgage rates have provided a boost to affordability that has partially offset the affordability loss from faster house price appreciation and lower household income. But, in a super-sellers’ market where nominal house prices are increasing rapidly, lower mortgages are not always enough.
In 2021, mortgage rates are anticipated to remain near historic lows and the economy should improve as vaccinations become more widespread. Both of these conditions will keep house-buying power strong in 2021. Yet, housing supply constraints will likely remain and continue to fuel a sellers’ market. The question is, will robust house-buying power be enough to offset strong nominal house price appreciation, or will the trend of declining affordability continue?
For more analysis of affordability, please visit the Real House Price Index.
The RHPI is updated monthly with new data. Look for the next edition of the RHPI the week of January 25, 2021.
Sources:
October 2020 Real House Price Index Highlights
The First American Real House Price Index (RHPI) showed that in October 2020:
- Real house prices increased 0.74 percent between September 2020 and October 2020.
- Real house prices declined 5.8 percent between October 2019 and October 2020.
- Consumer house-buying power, how much one can buy based on changes in income and interest rates, increased 0.9 percent between September 2020 and October 2020, and increased 17.6 percent year over year.
- Median household income has increased 5.6 percent since October 2019 and 71.7 percent since January 2000.
- Real house prices are 26 percent less expensive than in January 2000.
- While unadjusted house prices are now 18.2 percent above the housing boom peak in 2006, real, house-buying power-adjusted house prices remain 47.9 percent below their 2006 housing boom peak.
October 2020 Real House Price State Highlights
- The three states with the greatest year-over-year increase in the RHPI are: Wyoming (+2.7 percent), Vermont (+0.3 percent), and Oklahoma (+0.2 percent).
- The five states with the greatest year-over-year decrease in the RHPI are: California (-9.0 percent), New Hampshire (-7.6 percent), Hawaii (-7.6 percent), Massachusetts (-7.6 percent), and Nevada (-7.4 percent).
October 2020 Real House Price Local Market Highlights
- Among the Core Based Statistical Areas (CBSAs) tracked by First American, the five markets with the greatest year-over-year increase in the RHPI are: Cleveland (+4.8 percent), Pittsburgh (+4.0 percent), Kansas City, Mo. (+2.0 percent), New Orleans (+1.8 percent), and Nashville, Tenn. (+0.8 percent).
- Among the Core Based Statistical Areas (CBSAs) tracked by First American, the five markets with the greatest year-over-year decrease in the RHPI are: San Francisco (-16.9 percent), San Jose, Calif. (-13.6 percent), Boston (-11.6 percent), Miami (-10.9 percent), and Raleigh, N.C (-9.8 percent).
Next Release
The next release of the First American Real House Price Index will take place the week of January 25, 2021.
About the First American Real House Price Index
The traditional perspective on house prices is fixated on the actual prices and the changes in those prices, which overlooks what matters to potential buyers - their purchasing power, or how much they can afford to buy. First American’s proprietary Real House Price Index (RHPI) adjusts prices for purchasing power by considering how income levels and interest rates influence the amount one can borrow.
The RHPI uses a weighted repeat-sales house price index that measures the price movements of single-family residential properties by time and across geographies, adjusted for the influence of income and interest rate changes on consumer house-buying power. The index is set to equal 100 in January 2000. Changing incomes and interest rates either increase or decrease consumer house-buying power. When incomes rise and mortgage rates fall, consumer house-buying power increases, acting as a deflator of increases in the house price level. For example, if the house price index increases by three percent, but the combination of rising incomes and falling mortgage rates increase consumer buying power over the same period by two percent, then the Real House Price index only increases by 1 percent. The Real House Price Index reflects changes in house prices, but also accounts for changes in consumer house-buying power.
Disclaimer
Opinions, estimates, forecasts and other views contained in this page are those of First American’s Chief Economist, do not necessarily represent the views of First American or its management, should not be construed as indicating First American’s business prospects or expected results, and are subject to change without notice. Although the First American Economics team attempts to provide reliable, useful information, it does not guarantee that the information is accurate, current or suitable for any particular purpose. © 2020 by First American. Information from this page may be used with proper attribution.


