The three components of the Real House Price Index (RHPI) are household income, mortgage rates and a nominal house price index. The RHPI adjusts nominal house prices according to changes in income and interest rates, which together make up consumer house-buying power. When incomes rise, house-buying power rises as well. However, when mortgage rates rise, house-buying power declines. Similarly, house-buying power declines when unadjusted nominal house prices rise.
“Despite a likely increase in the lock-in effect if rates continue to rise, we expect home sales will continue to remain robust, but it won’t necessarily be fueled by the wealth effect.”
In February 2021, nominal house prices soared and mortgage rates increased, offsetting any affordability benefit from an increase in income levels. As a result, the RHPI increased 1.6 percent over January, meaning affordability declined. Yet, compared with one year ago, affordability improved 1.3 percent, according to the RHPI. Nationally, affordability is likely to wane further in March due to the modest rise in mortgage rates and faster house price appreciation outpacing gains in household income.
The Housing Wealth Effect: Fact or Fiction?
The rapid pace of annual nominal house price appreciation, just over 14 percent in February, begs the question: isn’t rapid house price growth good news for existing homeowners looking to move? According to a behavioral economic theory dubbed “the wealth effect,” homeowners are more likely to move if they feel “wealthier” because the value of their home rises. Yet, that homeowner would be entering the housing market at a time when all the other homes in the area have likely appreciated by the same amount. While the homeowner’s equity gains boost wealth, the equity gains allow the homeowner to keep pace with the housing market, rather than outpace it. So, if feeling wealthier doesn’t actually help buy more home, what can incentivize a homeowner to sell? Falling mortgage rates.
When rates fall, a potential home buyer can buy the same amount of home for a lower monthly payment or buy more home for the same monthly payment. The 30-year tailwind of declining mortgage rates has allowed homeowners to buy a home at one mortgage rate and then later sell and move into a more expensive home when rates are lower. This long-run decline in mortgage rates has encouraged existing homeowners to move out and move up.
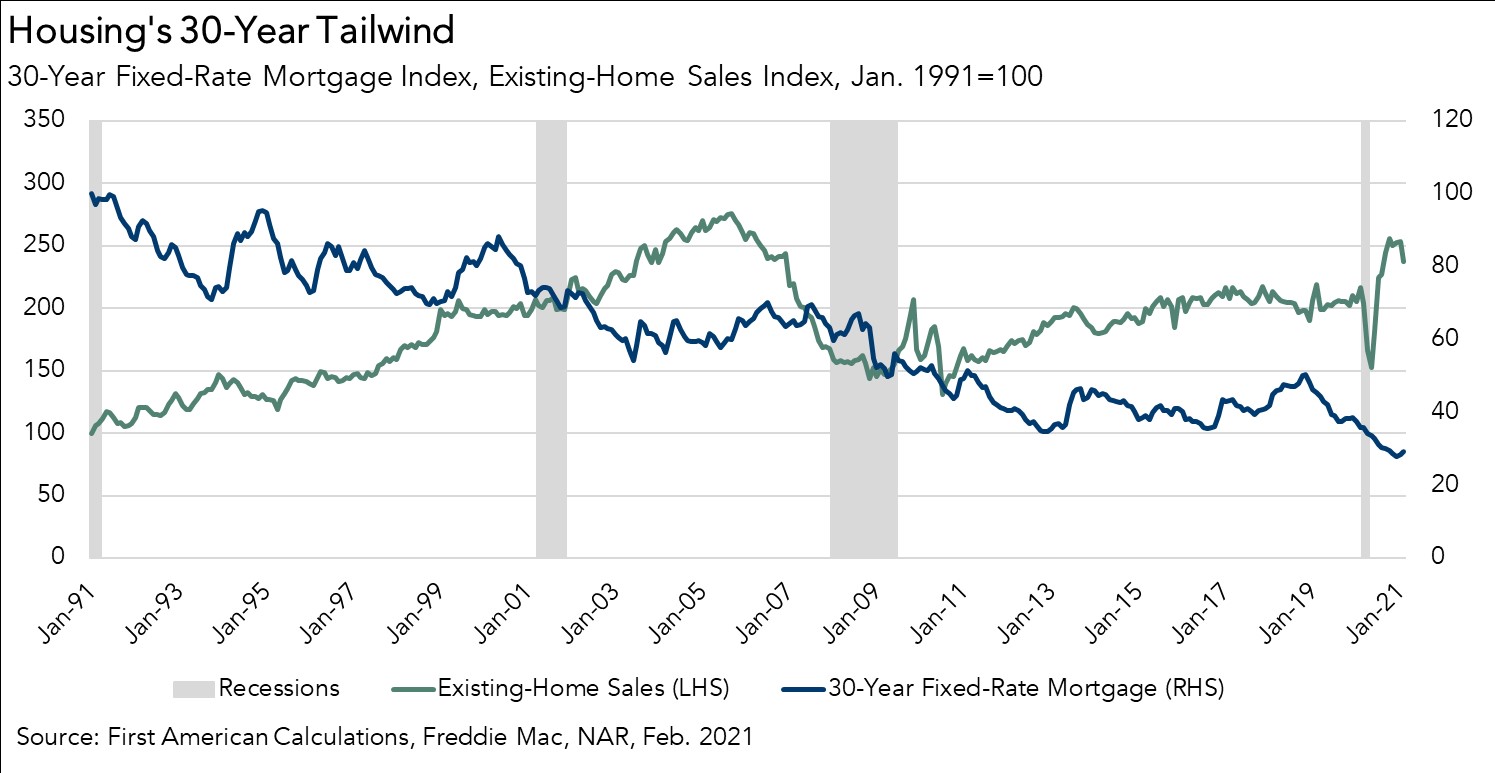
Existing Homeowners Locked In?
In 2021, the housing market has seen faster house price appreciation, modestly rising mortgage rates and record low levels of homes for sale. While existing homeowners are sitting on historically high levels of equity and feeling wealthier, many of these owners have also secured historically low fixed-rate mortgages. There is a financial “lock-in” effect that increases as mortgage rates rise and as the size of a mortgage increases. Instead of a tailwind, rising mortgage rates increase the monthly cost of borrowing the same amount that a homeowner owes on their existing mortgage. Why move out if you have to move “down” or pay more to move up?
The higher the prevailing market mortgage rate is relative to the homeowner’s existing mortgage rate, the stronger the lock-in effect. Additionally, the record low level of houses for sale makes it difficult to find the next house to buy, so sellers – who are also prospective buyers – don’t sell for fear of not finding something to buy. In short, existing homeowners are increasingly locked into their current homes as rates rise.
Wealthier homeowners may feel locked into their existing homes, but first-time home buyers have no such financial lock. As of December 2020, nearly 50 percent of all purchase mortgages originated by Fannie and Freddie went to first-time home buyers. Additionally, buying a home is often prompted by lifestyle decisions more so than financial considerations. Despite a likely increase in the lock-in effect if rates continue to rise, we expect home sales will continue to remain robust, but it won’t necessarily be fueled by existing homeowners moving out and moving up as a result of the wealth effect.
For more analysis of affordability, please visit the Real House Price Index. The RHPI is updated monthly with new data. Look for the next edition of the RHPI the week of May 24, 2021.
Sources:
February 2021 Real House Price Index Highlights
The First American Real House Price Index (RHPI) showed that in February 2021:
- Real house prices increased 1.6 percent between January 2021 and February 2021.
- Real house prices declined 1.3 percent between February 2020 and February 2021.
- Consumer house-buying power, how much one can buy based on changes in income and interest rates, increased 0.1 percent between January 2021 and February 2021, and increased 15.6 percent year over year.
- Median household income has increased 6.4 percent since February 2020 and 77.0 percent since January 2000.
- Real house prices are 25.0 percent less expensive than in January 2000.
- While unadjusted house prices are now 23.8 percent above the housing boom peak in 2006, real, house-buying power-adjusted house prices remain 47.2 percent below their 2006 housing boom peak.
February 2021 Real House Price State Highlights
- The five states with the greatest year-over-year increase in the RHPI are: Arizona (+8.4 percent), Wyoming (+8.4 percent), Vermont (+6.2 percent), Washington (+5.4 percent), and Mississippi (+5.3 percent).
- The five states with the greatest year-over-year decrease in the RHPI are: Iowa (-4.4 percent), Massachusetts (-3.5 percent), Illinois (-3.5 percent), New York (-3.4 percent), and California (-3.3 percent).
February 2021 Real House Price Local Market Highlights
- Among the Core Based Statistical Areas (CBSAs) tracked by First American, the five markets with the greatest year-over-year increase in the RHPI are: Kansas City, Mo. (+12.1 percent), Phoenix (+9.7 percent), Memphis, Tenn. (+9.0 percent), Hartford, Conn. (+8.9 percent), and Tampa, Fla. (+8.0 percent).
- Among the Core Based Statistical Areas (CBSAs) tracked by First American, the five markets with the greatest year-over-year decrease in the RHPI are: San Francisco (-10.0 percent), San Jose, Calif. (-7.8 percent), Miami (-5.8 percent), Boston (-5.7 percent), and Providence, R.I. (-4.1 percent).
Next Release
The next release of the First American Real House Price Index will take place the week of May 24, 2021.
About the First American Real House Price Index
The traditional perspective on house prices is fixated on the actual prices and the changes in those prices, which overlooks what matters to potential buyers - their purchasing power, or how much they can afford to buy. First American’s proprietary Real House Price Index (RHPI) adjusts prices for purchasing power by considering how income levels and interest rates influence the amount one can borrow.
The RHPI uses a weighted repeat-sales house price index that measures the price movements of single-family residential properties by time and across geographies, adjusted for the influence of income and interest rate changes on consumer house-buying power. The index is set to equal 100 in January 2000. Changing incomes and interest rates either increase or decrease consumer house-buying power. When incomes rise and mortgage rates fall, consumer house-buying power increases, acting as a deflator of increases in the house price level. For example, if the house price index increases by three percent, but the combination of rising incomes and falling mortgage rates increase consumer buying power over the same period by two percent, then the Real House Price index only increases by 1 percent. The Real House Price Index reflects changes in house prices, but also accounts for changes in consumer house-buying power.
Disclaimer
Opinions, estimates, forecasts and other views contained in this page are those of First American’s Chief Economist, do not necessarily represent the views of First American or its management, should not be construed as indicating First American’s business prospects or expected results, and are subject to change without notice. Although the First American Economics team attempts to provide reliable, useful information, it does not guarantee that the information is accurate, current or suitable for any particular purpose. © 2021 by First American. Information from this page may be used with proper attribution.


