Student loans are often cited as an insurmountable barrier to homeownership for young home buyers. It is true that student loan debt levels are higher today than a generation ago, but is it preventing potential home buyers from saving for a down payment? The recently released 2019 Survey of Consumer Finances data highlights some important trends that help put the burden of student loan debt into perspective.
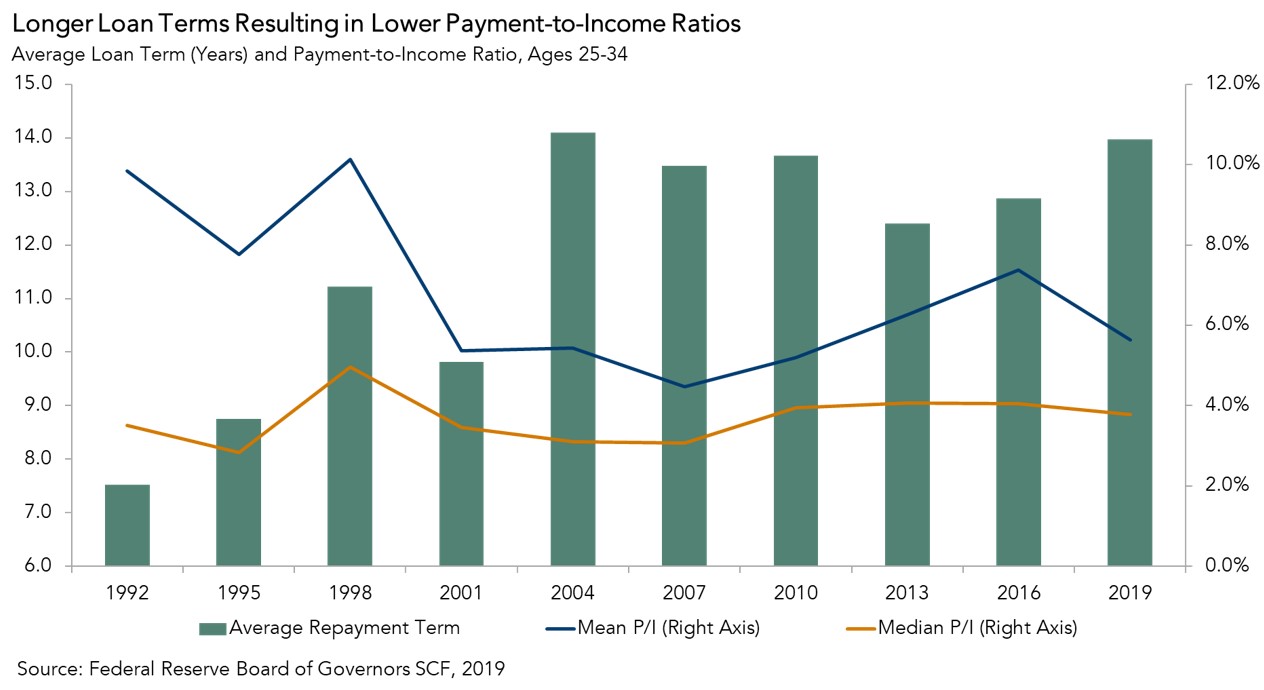
“Longer repayment terms and lower interest rates have resulted in increased 'student loan-buying power' and payment-to-income ratios that have remained steady over time.”
Student Loan Debt Payment-to-Income Ratios Have Declined
The steady increase in student loan debt over the past three decades has brought the issue of student loan debt burden into the national forefront. Between 1992 and 2019, average student debt increased from $12,600 to $40,600 in 2019 inflation-adjusted dollars, according to the Survey of Consumer Finances. That’s a dramatic increase, but it’s important to dig a little deeper. For example, the percentage of income dedicated to student loan debt repayment each month has, in fact, declined for the average young household. Between 2016 and 2019, the average payment-to-income ratio of a family with a household head between the ages of 25 and 34 declined from 7.4 percent to 5.6 percent, while the median remained nearly unchanged at 4 percent. How can the overall debt level be so much higher, yet the payment-to-income ratio be declining?
First, the average inflation-adjusted income for young households with student debt increased from $63,000 to $83,000 between 1992 and 2019. But, much like a mortgage, monthly student loan payments depend on more than just the loan amount and income of the borrower. The average loan repayment term has increased from 7.5 years in 1992 to 14 years in 2019, keeping payment-to-income ratios down. Just like going from a 15-year mortgage to a 30-year mortgage allows you to borrow more money for a similar monthly payment, almost doubling the student loan repayment term accommodates more student loan debt for a similar monthly payment.
At the same time, interest rates have declined. From 1992 to 2019, the average annual interest rate on a student loan has declined by 2 percentage points, from nearly 8 percent to just below 6 percent. Longer repayment terms and lower interest rates have resulted in increased “student loan-buying power” and payment-to-income ratios that have remained steady over time. Of course, an important question to consider is whether the reason for this debt – education – is worth the investment in the first place.
The Returns on Education
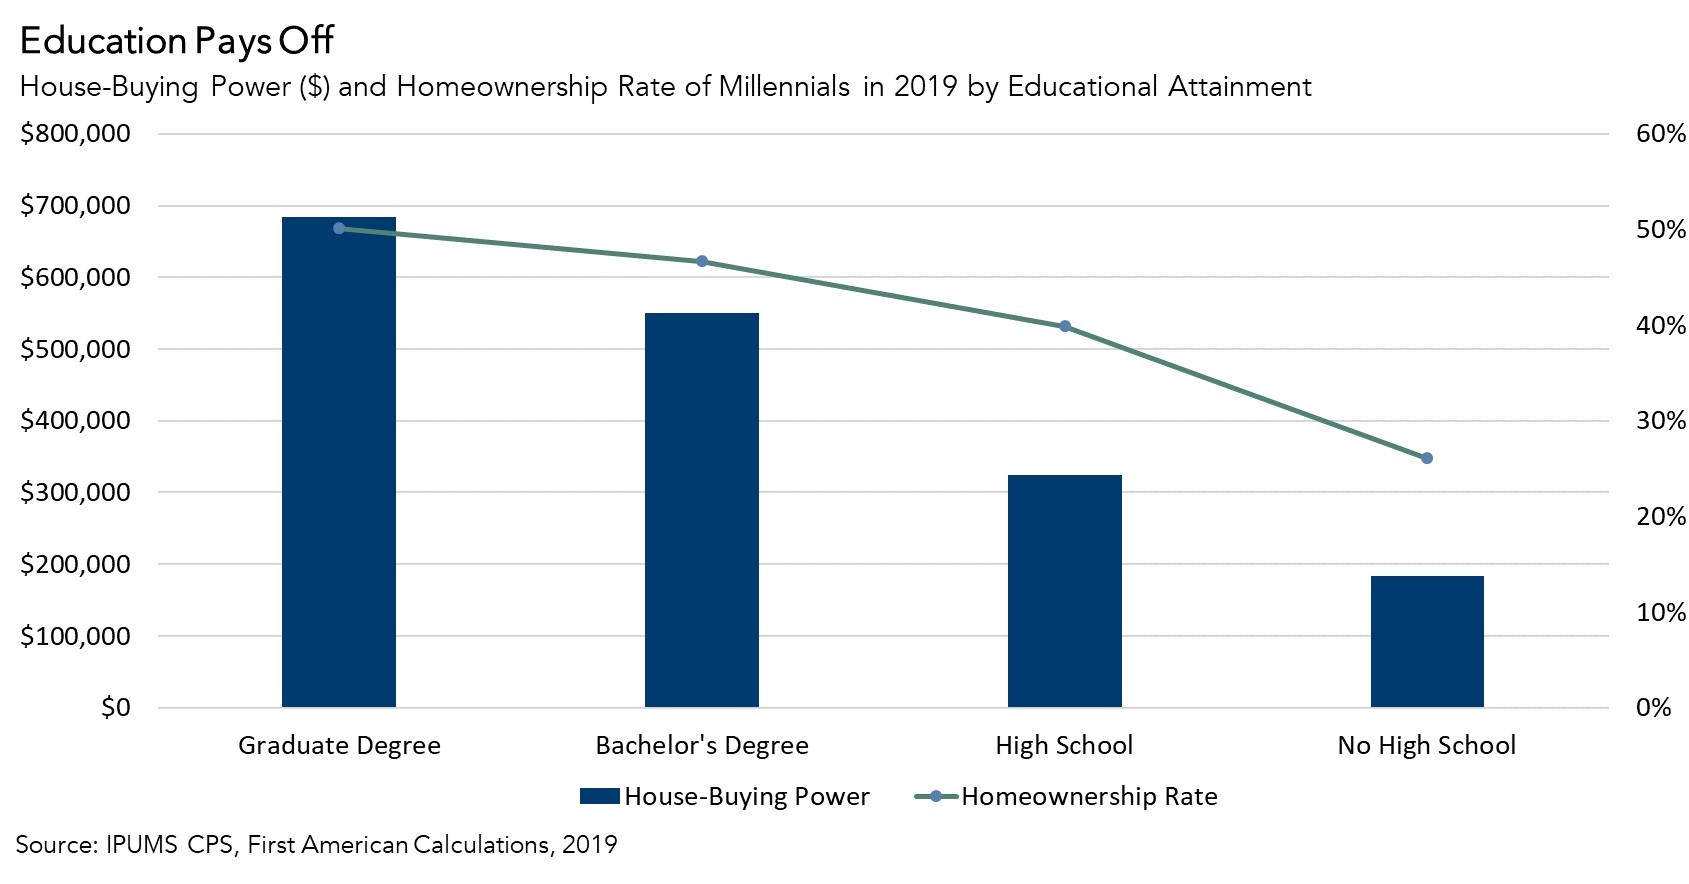
Higher educational attainment generally leads to higher household income, which translates into increased house-buying power. In 2019, the difference in house-buying power between a millennial with a high school degree (or some college/associate degree) and a millennial with a bachelor’s degree was approximately $225,000. This helps explain why the homeownership rate in 2019 among millennials with a bachelor’s degree was 6.8 percentage points higher than the homeownership rate among millennials with a high school degree.
Student loan debt levels have increased over time, but student loan-buying power has increased sufficiently to keep the monthly payment burden from increasing. This could be one of the reasons why student loan debt is more likely to delay, rather than prevent homeownership. So, with student loan debt burden moderated by stable payment-to-income ratios, and a significant return on investment from higher education accruing to the most educated generation yet, millennial demand for homeownership remains poised to continue to fuel a 'roaring 20s' of homeownership demand.
Ksenia Potapov contributed to this blog post.

.jpg)
