Even though nominal house prices continued to surge, affordability improved in November as two of the three key drivers of the Real House Price Index (RHPI), household income and mortgage rates, swung in favor of increased affordability. Real house prices declined by 6.2 percent relative to one year ago, thanks to the benefit of increased buying power.
“Economic and demographic context matters and, even if rising rates persist in 2021, the context is good for the housing market.”
While mortgage rates fell in November, in more recent data from January 2021, mortgage rates have increased slightly due to a more positive economic outlook. The uptick in rates sparked questions about how the housing market will react as rates rise.
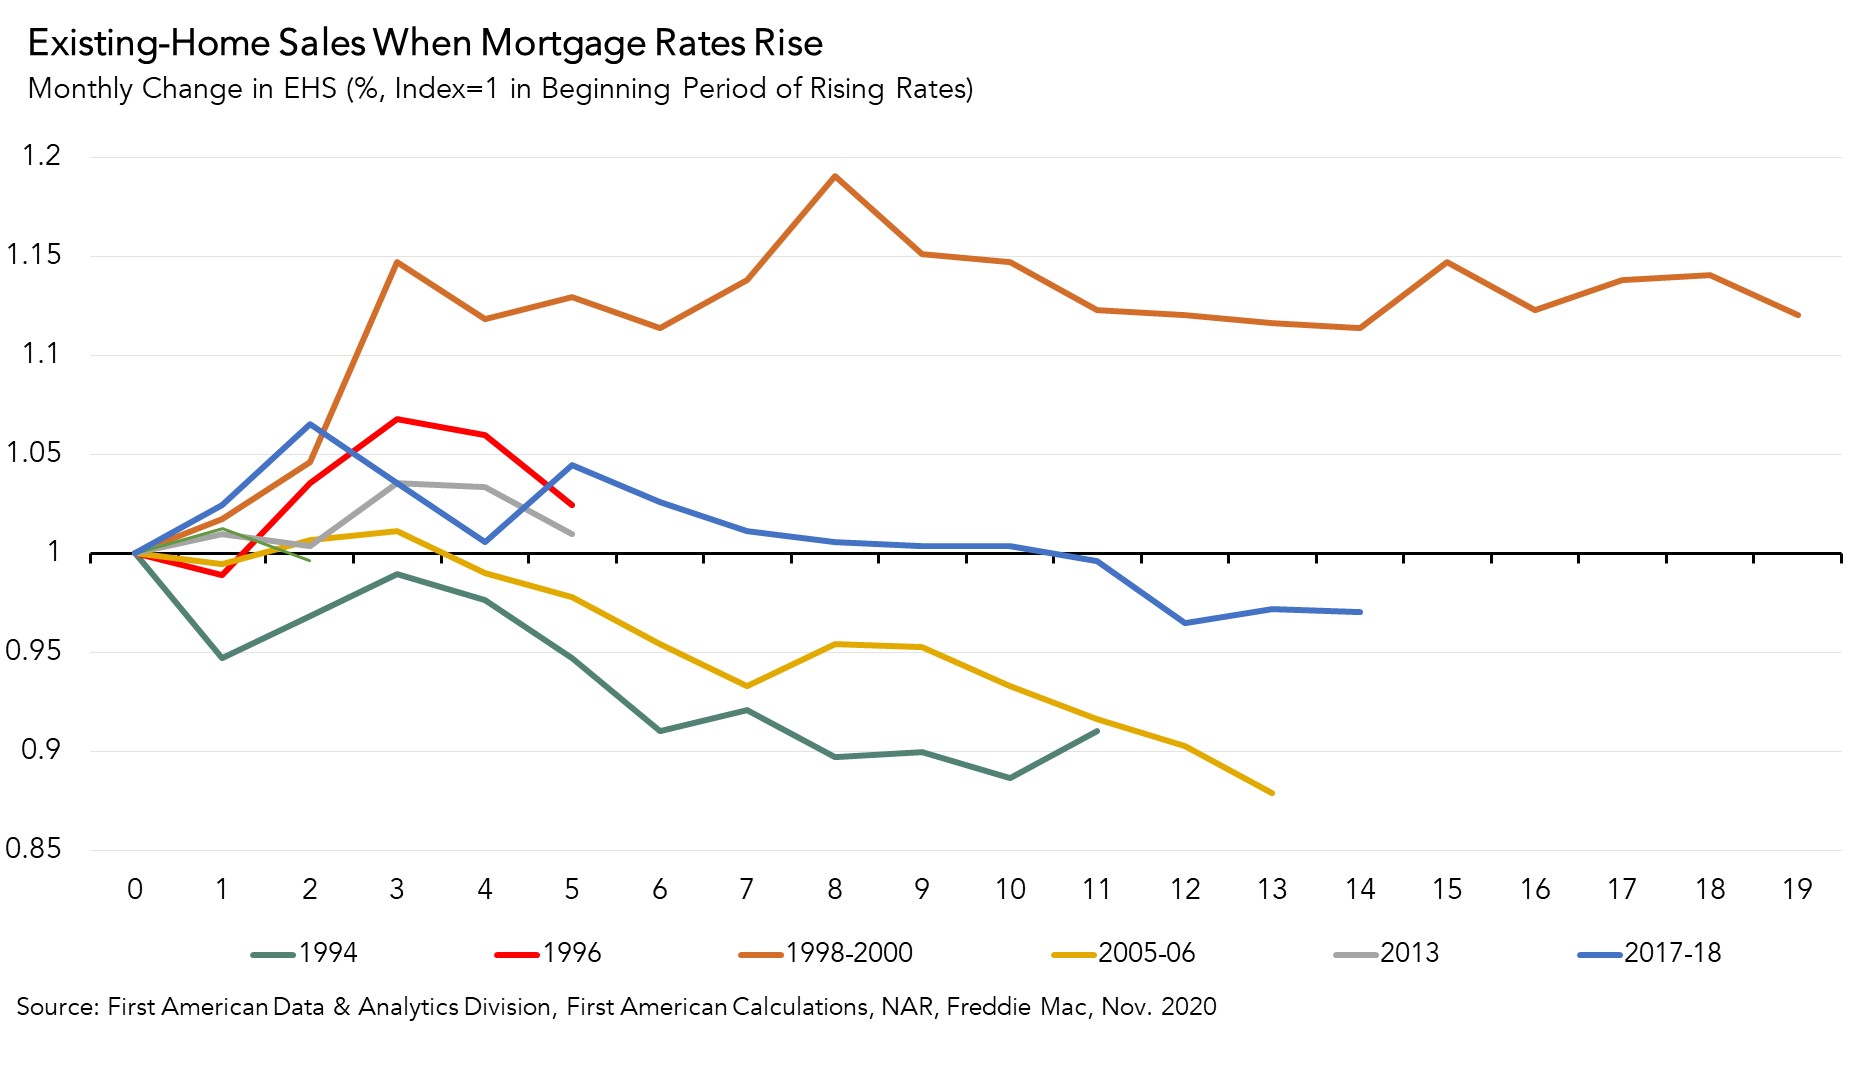
Existing-Home Sales When Mortgage Rates Rise
Historically, when mortgage rates rise, existing-home sales don’t necessarily fall. The graph below shows how the housing market responded to six significant rising-rate eras over the last 30 years. The 2005-2006 rising-rate era preceding the 2008 housing crisis stands out because existing-home sales fell dramatically. Existing-home sales also decreased in the 1994 rising-rate era, as the Federal Reserve increased the federal funds rate to prevent strong economic growth from feeding inflation. However, in the four other rising-rate eras graphed, existing-home sales increased (1996, 1998-2000, 2013), or only declined after prolonged resistance (2017-2018). Context matters and each rising-rate era is different. The housing market response depends on the reason why rates are rising.
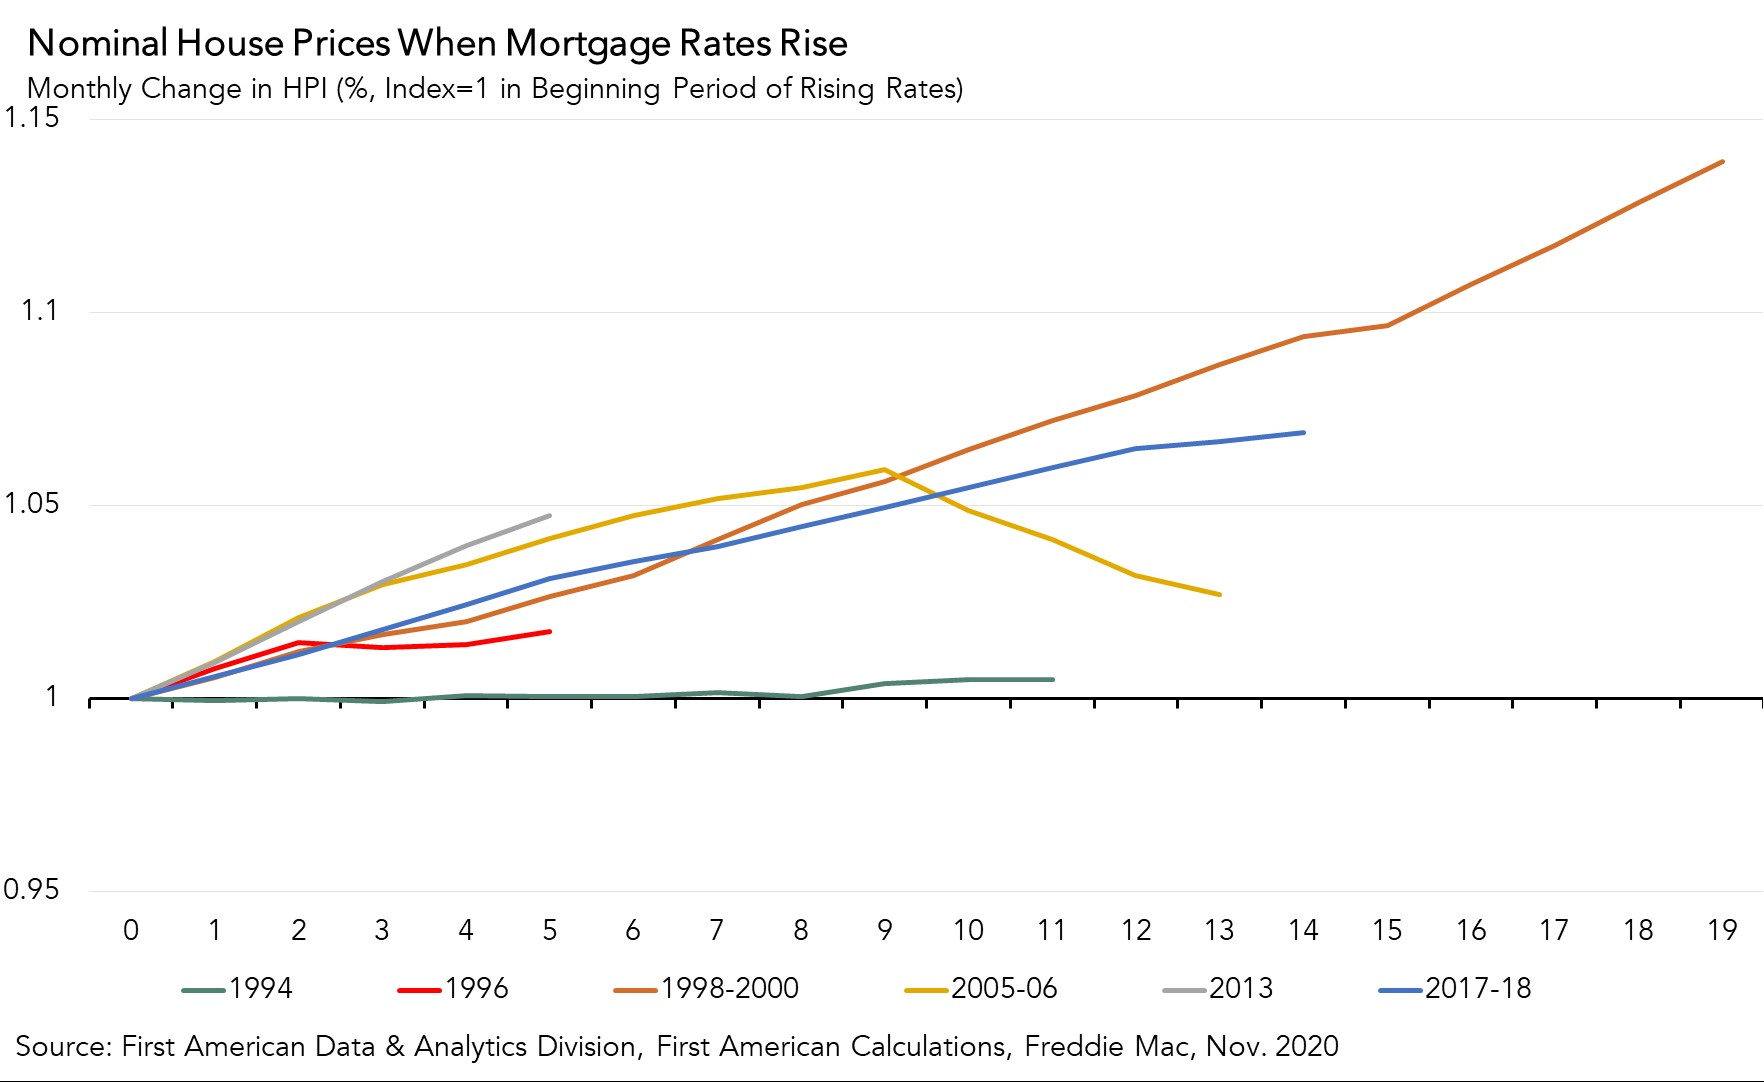
House Prices Are Even More Resilient
The graph below shows unadjusted house prices in the same six rising-rate eras. House prices are clearly resistant to rising mortgage rates. Apart from the 1994 rising-rate period, when house prices declined slightly and briefly, house prices have always continued to rise, albeit more slowly, when rates have increased. In the 2005-2006 housing bubble, house prices eventually declined after initially increasing, but never declined below the level at the beginning of the rising-rate era.
In the longest rising mortgage rate era, 1998-2000, nominal house prices increased consistently with the economic recovery from the previous recession. In just over a year and a half, house prices increased 14 percent. House price appreciation is resistant to rising mortgage rates primarily because home sellers would rather withdraw from the market than sell at lower prices – a phenomenon we refer to as “downside sticky.”
Housing Market is Resilient to Rising Rates
The lesson? Context matters and prices are “downside sticky.” The housing market is complex and dynamic, and it responds to a variety of demographic, economic and monetary conditions. Rising interest rates reduce house-buying power and affordability, but are often a sign of a strong economy, which increases home buyer demand. By any historic standard, today’s mortgage rates remain historically low and will continue to boost house-buying power and keep purchase demand robust. At the same time, millennials aging into their prime home-buying years and a limited supply of homes for sale make for a housing market that is well positioned for rising rates. Economic and demographic context matters and, even if rising rates persist in 2021, the context is good for the housing market.
For more analysis of affordability, please visit the Real House Price Index.
The RHPI is updated monthly with new data. Look for the next edition of the RHPI the week of February 22, 2021.
Sources:
November 2020 Real House Price Index Highlights
The First American Real House Price Index (RHPI) showed that in November 2020:
- Real house prices increased 0.5 percent between October 2020 and November 2020.
- Real house prices declined 6.2 percent between November 2019 and November 2020.
- Consumer house-buying power, how much one can buy based on changes in income and interest rates, increased 1.0 percent between October 2020 and November 2020, and increased 18.9 percent year over year.
- Median household income has increased 5.8 percent since November 2019 and 72.1 percent since January 2000.
- Real house prices are 26 percent less expensive than in January 2000.
- While unadjusted house prices are now 19.4 percent above the housing boom peak in 2006, real, house-buying power-adjusted house prices remain 48.0 percent below their 2006 housing boom peak.
November 2020 Real House Price State Highlights
- The only state with a year-over-year increase in the RHPI is Wyoming (+2.3 percent).
- The five states with the greatest year-over-year decrease in the RHPI are: California (-9.3 percent), Massachusetts (-8.5 percent), Louisiana (-8.5 percent), New York (-7.7 percent), and Hawaii (-7.7 percent).
November 2020 Real House Price Local Market Highlights
- Among the Core Based Statistical Areas (CBSAs) tracked by First American, the five markets with the greatest year-over-year increase in the RHPI are: Cleveland (+4.7 percent), Pittsburgh (+2.4 percent), Kansas City, Mo. (+2.3 percent), Hartford, Conn. (+1.2 percent), and Memphis, Tenn. (+0.7 percent).
- Among the Core Based Statistical Areas (CBSAs) tracked by First American, the five markets with the greatest year-over-year decrease in the RHPI are: San Francisco (-17.5 percent), San Jose, Calif. (-14.0 percent), Boston (-12.2 percent), Miami (-11.0. percent), and San Diego (-9.7 percent).
About the First American Real House Price Index
The traditional perspective on house prices is fixated on the actual prices and the changes in those prices, which overlooks what matters to potential buyers - their purchasing power, or how much they can afford to buy. First American’s proprietary Real House Price Index (RHPI) adjusts prices for purchasing power by considering how income levels and interest rates influence the amount one can borrow.
The RHPI uses a weighted repeat-sales house price index that measures the price movements of single-family residential properties by time and across geographies, adjusted for the influence of income and interest rate changes on consumer house-buying power. The index is set to equal 100 in January 2000. Changing incomes and interest rates either increase or decrease consumer house-buying power. When incomes rise and mortgage rates fall, consumer house-buying power increases, acting as a deflator of increases in the house price level. For example, if the house price index increases by three percent, but the combination of rising incomes and falling mortgage rates increase consumer buying power over the same period by two percent, then the Real House Price index only increases by 1 percent. The Real House Price Index reflects changes in house prices, but also accounts for changes in consumer house-buying power.
Disclaimer
Opinions, estimates, forecasts and other views contained in this page are those of First American’s Chief Economist, do not necessarily represent the views of First American or its management, should not be construed as indicating First American’s business prospects or expected results, and are subject to change without notice. Although the First American Economics team attempts to provide reliable, useful information, it does not guarantee that the information is accurate, current or suitable for any particular purpose. © 2021 by First American. Information from this page may be used with proper attribution.


