In April, housing affordability improved relative to one month ago, as two of the three key drivers of the Real House Price Index (RHPI), income and mortgage rates boosted house-buying power by 2.3 percent. Median household incomes increased by 0.1 percent compared with March, while mortgage rates dipped by 0.2 percentage points. Nominal house price growth was up 0.4 percent compared with one month ago, but it was not enough to offset the affordability boost from rising incomes and falling rates. Nominal house price growth has re-accelerated in recent months and even reached a new peak in April.
“Nominal house prices need to adjust to the reality of higher mortgage rates for the housing market to become more affordable and balanced, but a fundamental housing supply shortage is keeping a floor on how low house prices can go.”
Do Rising Mortgage Rates Always Slow Nominal House Price Appreciation?
Since 2021, the housing market has slowed by design as the Federal Reserve tightened monetary policy to tame inflation, which has, in turn, cooled the housing market. Yet, house prices have remained resilient, even in the face of fast-rising mortgage rates. That’s because the relationship between rising mortgage rates and home prices may not be as straightforward as many believe.
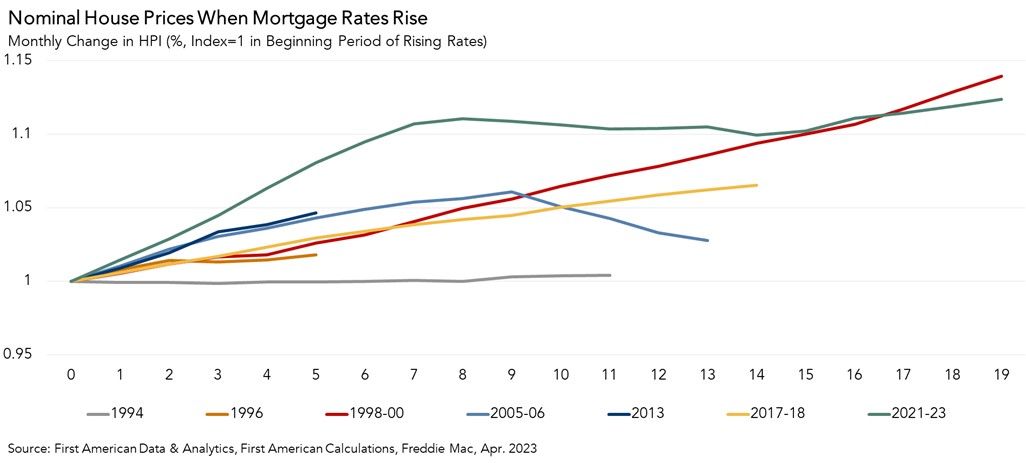
The graph below shows unadjusted house prices in seven rising mortgage rate eras over the past three decades. It quickly becomes apparent that house prices seem to be resistant to rising mortgage rates. Apart from the 1994 rising-rate period, when house prices declined slightly and briefly, house prices have often continued to rise, albeit more slowly, when rates have increased. The other exception is the 2005-2006 period, during the U.S. housing bubble, when house prices peaked in early 2006 and subsequently declined.
In one of the longest rising mortgage rate eras, 1998-2000, nominal house prices remained elevated as the economy continued to recover from the previous recession. This period was defined by tight labor markets, low inflation, and an increase in the minimum wage, all contributing to a healthy housing market. During this era, house prices increased 14 percent nationally in just over a year and a half. In the 2017-2018 rising mortgage rate era, nominal house prices increased approximately 7 percent in 15 weeks.
In today’s housing market, nominal house prices declined in the second half of 2022, but have since re-accelerated. Since the start of this rising mortgage rate era, house prices have increased by over 12 percent nationally. Nominal house prices need to adjust to the reality of higher mortgage rates to allow for the housing market to become more affordable and balanced, but a fundamental housing supply shortage is keeping a floor on how low house prices can go.
Where are Nominal House Prices Headed?
The takeaway is that, historically, house prices are resilient to rising mortgage rates, but just how resilient depends on the economic environment. House prices are generally ‘downside sticky,’ as home sellers would rather withdraw from the market than sell at lower prices. Additionally, housing supply remains so restricted that any uptick in demand will put upward pressure on prices.
Even as the Federal Reserve continues to fight inflation with restrictive monetary policy, which will keep upward pressure on mortgage rates, don’t expect house prices to decline dramatically. History has shown that higher rates may take the steam out of rising prices, but it doesn’t cause them to collapse entirely. This is especially true in today’s housing market, where the demand for homes continues to outpace supply, keeping the pressure on house prices.
For more analysis of affordability, please visit the Real House Price Index. The RHPI is updated monthly with new data. Look for the next edition of the RHPI the week of July 17, 2023.
Sources:
April 2023 Real House Price Index Highlights
The First American Real House Price Index (RHPI) showed that in April 2023:
- Real house prices decreased 1.8 percent between March 2023 and April 2023.
- Real house prices increased 13.5 percent between April 2022 and April 2023.
- Consumer house-buying power, how much one can buy based on changes in income and mortgage rates, increased 2.3 percent between March 2023 and April 2023, and decreased 10.5 percent year over year.
- Median household income has increased 3.8 percent since April 2022 and 81.6 percent since January 2000.
- Real house prices are 34.6 percent more expensive than in January 2000.
- Unadjusted house prices are now 50 percent above the housing boom peak in 2006, while real, house-buying power-adjusted house prices are 5.8 percent below their 2006 housing boom peak.
April 2023 Real House Price State Highlights
- The five states with the greatest year-over-year increase in the RHPI are: Illinois (+20.5 percent), Alabama (+20.1 percent), New Jersey (+20.0 percent), Wisconsin (+19.6 percent), and Maryland (+19.1 percent).
- There were no states with a year-over-year decrease in the RHPI.
April 2023 Real House Price Local Market Highlights
- Among the Core Based Statistical Areas (CBSAs) tracked by First American, the five markets with the greatest year-over-year increase in the RHPI are: Miami (+27.4 percent), St. Louis (+22.6 percent), Hartford, Conn. (+21.9 percent), Jacksonville, Fla. (+21.6 percent), and Chicago (+20.5 percent).
- Among the Core Based Statistical Areas (CBSAs) tracked by First American, the only market with a year-over-year decrease in the RHPI is Salt Lake City (-5.8 percent).
About the First American Real House Price Index
The traditional perspective on house prices is fixated on the actual prices and the changes in those prices, which overlooks what matters to potential buyers - their purchasing power, or how much they can afford to buy. First American’s proprietary Real House Price Index (RHPI) adjusts prices for purchasing power by considering how income levels and interest rates influence the amount one can borrow.
The RHPI uses a weighted repeat-sales house price index that measures the price movements of single-family residential properties by time and across geographies, adjusted for the influence of income and interest rate changes on consumer house-buying power. The index is set to equal 100 in January 2000. Changing incomes and interest rates either increase or decrease consumer house-buying power. When incomes rise and mortgage rates fall, consumer house-buying power increases, acting as a deflator of increases in the house price level. For example, if the house price index increases by three percent, but the combination of rising incomes and falling mortgage rates increase consumer buying power over the same period by two percent, then the Real House Price index only increases by 1 percent. The Real House Price Index reflects changes in house prices, but also accounts for changes in consumer house-buying power.
Disclaimer
Opinions, estimates, forecasts and other views contained in this page are those of First American’s Chief Economist, do not necessarily represent the views of First American or its management, should not be construed as indicating First American’s business prospects or expected results, and are subject to change without notice. Although the First American Economics team attempts to provide reliable, useful information, it does not guarantee that the information is accurate, current or suitable for any particular purpose. © 2023 by First American. Information from this page may be used with proper attribution.


