Affordability has now improved for four straight months, yet remains down 32 percent since February 2022, according to the Real House Price Index (RHPI). Recently falling mortgage rates have overpowered the affordability-dampening effects of higher nominal house prices. Nominal house price appreciation has slowed dramatically in response to affordability-constrained lower demand. After peaking in March 2022 at 21 percent nationally, annual nominal house price growth has since decelerated by 18 percentage points to 3.1 percent in February.
“A softening labor market combined with declining house prices may ultimately increase foreclosures, but the increase is more likely to be a trickle than a tsunami.”
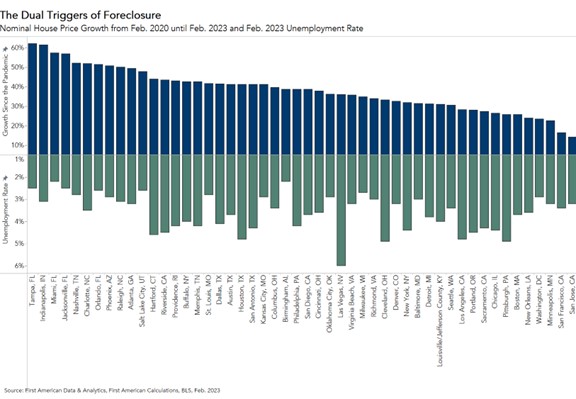
Real estate is local, and house prices are down from their peaks in 37 of the top 50 markets. With house prices declining, some are concerned about the rising risk of a wave of foreclosures. Yet, foreclosures are the result of two triggers: economic hardship and lack of equity.
The Dual Triggers Necessary for Foreclosure
Foreclosure is a two-step process. First, the homeowner suffers an adverse economic shock, such as a loss of income, serious illness, or the death of a spouse, leading to the homeowner becoming delinquent on their mortgage. However, not every delinquency turns into a foreclosure. With enough equity, a homeowner has the option of selling the home.
The reverse is also true. If the homeowner has little equity in their home, but suffers no financial setback that leads to delinquency, there is no need for a foreclosure. This is what we call the “dual-trigger hypothesis.” Economic hardship or a lack of equity are alone insufficient to trigger a foreclosure. Only when both conditions exist does foreclosure become a likely outcome.
Equity Levels Remain High
While nominal house prices are declining across many of the top 50 markets, there is one trend that bodes well for homeowners in all markets – much of the equity gained during the pandemic remains. For example, San Jose, Calif. has experienced the most severe price declines from the peak, yet house prices remain 14 percent above their pre-pandemic level. As the housing market rebalances, price declines will continue across many markets, but those declines would have to be substantial to erase all of the equity gains accumulated by homeowners during the pandemic boom. Additionally, inventory remains historically low in many top markets, putting a floor on how low house prices can fall. The risk of the equity trigger for foreclosure is low.
Unemployment Still Below Pre-Pandemic Averages
While low compared with pre-pandemic levels, rising economic distress and the end of the foreclosure moratorium in 2021 have caused economic hardship for some, especially those homeowners directly impacted by the pandemic. Foreclosures have increased from near zero, but remain well below pre-pandemic levels. Nonetheless, unemployment rates across the top 50 markets remain low. Las Vegas had the highest unemployment rate (6.0 percent) in February 2023, but still has a lower unemployment rate than its pre-pandemic historic average. Additionally, even as the Las Vegas unemployment rate sits above other top markets, house prices in Las Vegas are up 36 percent compared with pre-pandemic levels. All 49 other top markets had an unemployment rate below 5 percent, which is lower than the pre-pandemic national historical average of 5.8 percent. So far, layoffs have not been broad based, and the protection that equity provides to those that have experienced economic hardship has helped to keep foreclosures from rising faster.
Foreclosure Tsunami or Just a Trickle?
Economic distress and a lack of equity are the two triggers of a foreclosure. Alone, each trigger is necessary, but not sufficient to trigger a foreclosure. The equity acquired since the start of the pandemic can provide an important buffer for distressed homeowners. Additionally, while the labor market is showing some early signs of slowing and economic distress is increasing, unemployment rates remain low across the top 50 markets. A softening labor market combined with declining house prices may ultimately increase foreclosures, but the increase is more likely to be a trickle than a tsunami.
For more analysis of affordability, please visit the Real House Price Index. The RHPI is updated monthly with new data. Look for the next edition of the RHPI the week of May 29, 2023.
Sources:
February 2023 Real House Price Index Highlights
The First American Real House Price Index (RHPI) showed that in February 2023:
- Real house prices decreased 0.2 percent between January 2023 and February 2023.
- Real house prices increased 31.6 percent between February 2022 and February 2023.
- Consumer house-buying power, how much one can buy based on changes in income and interest rates, increased 0.5 percent between January 2023 and February 2023, and decreased 21.7 percent year over year.
- Median household income has increased 4.1 percent since January 2022 and 80.8 percent since January 2000.
- Real house prices are 33.3 percent more expensive than in January 2000.
- Unadjusted house prices are now 50 percent above the housing boom peak in 2006, while real, house-buying power-adjusted house prices are 6.5 percent below their 2006 housing boom peak.
February 2023 Real House Price State Highlights
- The five states with the greatest year-over-year increase in the RHPI are: Maryland (+41.3 percent), Nebraska (+40.0 percent), Alabama (+39.7 percent), Iowa (+39.6 percent), and Florida (+39.5 percent).
- There were no states with a year-over-year decrease in the RHPI.
February 2023 Real House Price Local Market Highlights
- Among the Core Based Statistical Areas (CBSAs) tracked by First American, the five markets with the greatest year-over-year increase in the RHPI are: Miami (+50.0 percent), Indianapolis (+45.3 percent), Jacksonville, Fla. (+42.5 percent), Baltimore (+40.1 percent), and Louisville, Ky. (+40.1 percent).
- Among the Core Based Statistical Areas (CBSAs) tracked by First American, there were no markets with a year-over-year decrease in the RHPI.
About the First American Real House Price Index
The traditional perspective on house prices is fixated on the actual prices and the changes in those prices, which overlooks what matters to potential buyers - their purchasing power, or how much they can afford to buy. First American’s proprietary Real House Price Index (RHPI) adjusts prices for purchasing power by considering how income levels and interest rates influence the amount one can borrow.
The RHPI uses a weighted repeat-sales house price index that measures the price movements of single-family residential properties by time and across geographies, adjusted for the influence of income and interest rate changes on consumer house-buying power. The index is set to equal 100 in January 2000. Changing incomes and interest rates either increase or decrease consumer house-buying power. When incomes rise and mortgage rates fall, consumer house-buying power increases, acting as a deflator of increases in the house price level. For example, if the house price index increases by three percent, but the combination of rising incomes and falling mortgage rates increase consumer buying power over the same period by two percent, then the Real House Price index only increases by 1 percent. The Real House Price Index reflects changes in house prices, but also accounts for changes in consumer house-buying power.
Disclaimer
Opinions, estimates, forecasts and other views contained in this page are those of First American’s Chief Economist, do not necessarily represent the views of First American or its management, should not be construed as indicating First American’s business prospects or expected results, and are subject to change without notice. Although the First American Economics team attempts to provide reliable, useful information, it does not guarantee that the information is accurate, current or suitable for any particular purpose. © 2023 by First American. Information from this page may be used with proper attribution.


