Traditional measures of affordability can be misleading to potential first-time home buyers because they compare overall median household income with the income required to purchase a median-priced home. However, median household income includes existing homeowner households, which have significantly higher median income than renter households, so it skews affordability measures.
“If the price of a home increases by $1,900, but your purchasing power increases by six times that amount, is homeownership for the potential first-time home buyer more or less affordable?”
Our estimate of a first-time buyer’s house-buying power is based on the median renter’s household income. The renter house-buying power estimate also considers the prevailing 30-year, fixed-rate mortgage, and assumes one-third of the first-time home buyer’s pre-tax income is used to pay the mortgage principal and interest. Using this measure, we can identify the share of homes for sale in any given market that are affordable for the median renter household.
Has the Outlook for First-Time Home Buyers Changed Since the Fourth Quarter of 2018?
Since our fourth-quarter 2018 First-Time Home Buyer Report, the housing market has changed mostly in favor of first-time home buyers. Nationally, the median sale price of a home increased from $215,300 in the last quarter of 2018 to $217,200 in the first quarter of 2019. While the increase in nominal prices makes housing less affordable, several affordability tailwinds worked to help first-time home buyers.
Mortgage rates declined 0.41 percentage points between the last quarter of 2018 and the first quarter of 2019, boosting affordability. Additionally, due to a continued strong labor market, median household income for renter households increased in the first quarter of this year. As a result, renter house-buying power increased by nearly $12,000 between the last quarter of 2018 and the first quarter of this year. If the price of a home increases by $1,900, but your purchasing power increases by six times that amount, is homeownership for the potential first-time home buyer more or less affordable?
Share of Affordable Homes on the Rise for First-Time Home Buyers
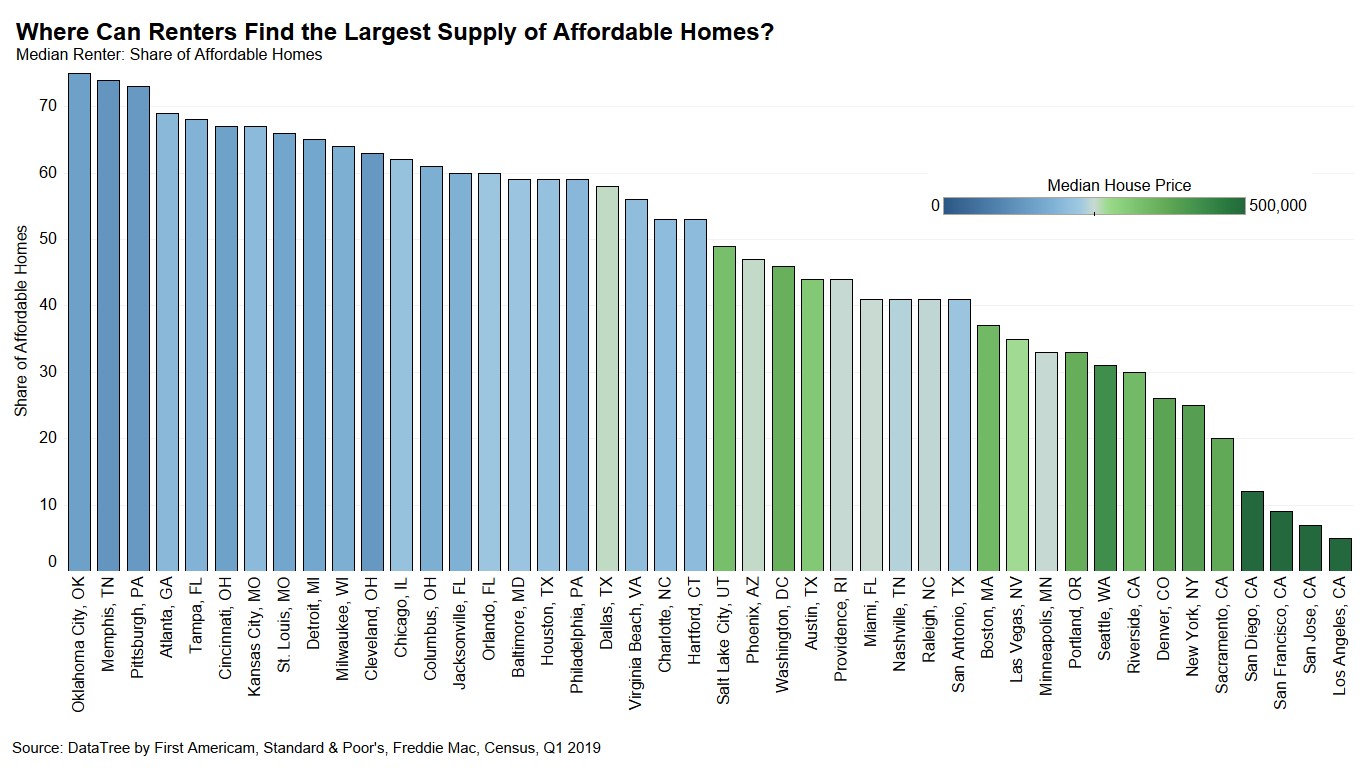
In the first quarter of 2019, the most affordable city among the largest 50 cities for median renters looking to buy their first home was Oklahoma City. The median renter in Oklahoma City, with an income of $36,350 and house-buying power of $207,061, could afford 75 percent of the homes for sale in the quarter.
Los Angeles, on the other hand, was the least affordable city, with a median house price of $621,667, which is 186 percent above the median house price nationally of $217,200. The median renter in Los Angeles, with an income of $49,600 and a house-buying power of approximately $284,000, could only afford 5 percent of the homes sold in Los Angeles in the first quarter of 2019. The good news is affordability improved in both Oklahoma City and Los Angeles compared with last quarter, due to increasing renter household income and, more importantly, the decline in mortgage rates.
In fact, the share of affordable homes for the median renter increased in all of the top 10 most affordable cities, compared with the fourth quarter of 2018. Oklahoma City overtook Memphis as the most affordable city for median renters.
The 10 Cities Where the Median Renter Can Find the Largest Supply of Affordable Homes to Buy
- 1. Oklahoma City: 75 percent
- 2. Memphis, Tenn.: 74 percent
- 3. Pittsburgh: 73 percent
- 4. Atlanta: 69 percent
- 5. Tampa, Fla.: 68 percent
- 6. Cincinnati: 67 percent
- 7. Kansas City, Mo.: 67 percent
- 8. St. Louis: 66 percent
- 9. Detroit: 65 percent
- 10. Milwaukee: 64 percent

Affordability Equilibrium?
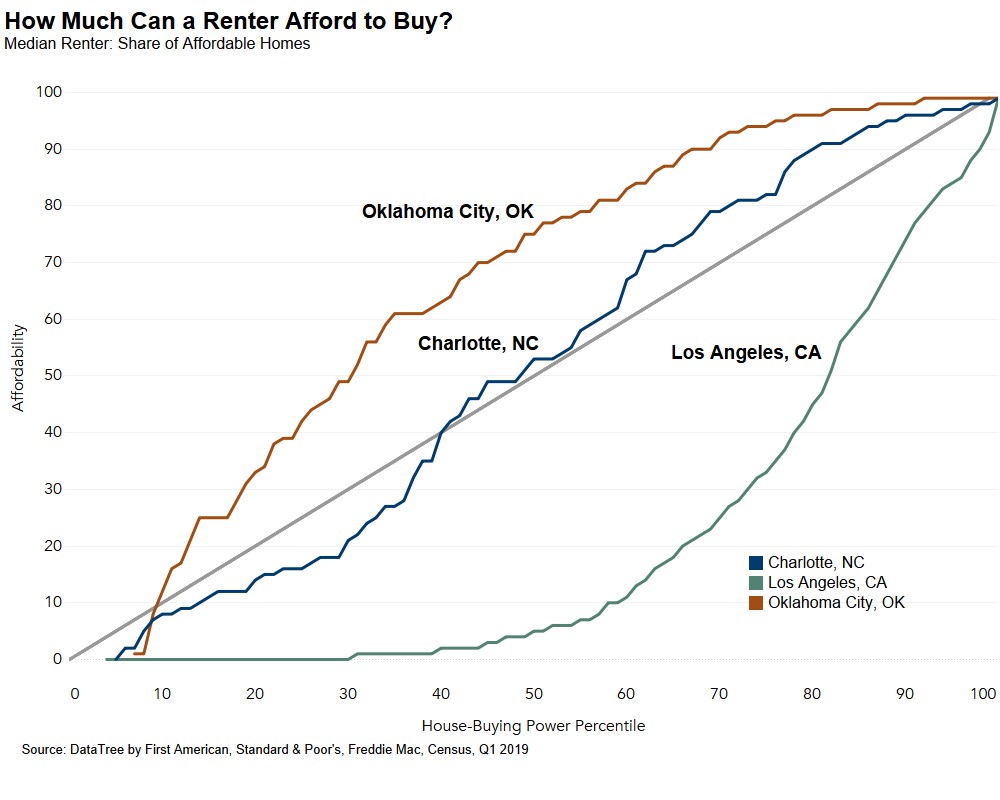
Where a first-time home buyer sits in the house-buying power distribution greatly influences the supply of affordable homes they are able to afford. In fact, we can identify the point at which each household in the rental income distribution can afford an equal share of homes for sale in their market – the point of renter affordability equilibrium for that city.
Let’s take three examples: Oklahoma City is the most affordable for median renters, Los Angeles is the least affordable, and Charlotte, N.C. is in the middle. The 45-degree line running through the middle of the chart represents renter affordability equilibrium. If you’re along this line, that means that each household in the rental income distribution from lowest to highest can afford an equal share of homes for sale in their market.
Let’s take a renter on the lower end of the house-buying power distribution at 30 percent. In Los Angeles, the 30th percentile rental household has a house-buying power of $165,927 and can afford less than one percent of homes for sale. On the contrary, in Oklahoma City, the 30th percentile rental household can afford 49 percent of homes for sale, with a renter house-buying power of $148,344. Finally, in Charlotte, the 30th percentile rental household can afford 21 percent of homes available for sale in the city, with a house-buying power of $122,588. Those above renter affordability equilibrium line can afford more than their “share” of homes for sale and those below can afford less than their “share.”
So, if you’re looking to enhance your ability to find an affordable city to purchase your first home, consider Oklahoma City, Memphis, or Pittsburgh – where the share of homes affordable to renters exceeds their rank in the income distribution.

Data Sources:


