Over the past year, increasing investor activity in residential real estate, particularly in single-family homes, has drawn a lot of attention. News of large institutional investors snapping up single-family homes underscored this summer’s historically hot housing market. Investors now own an estimated 2 percent of single-family rental housing units in the U.S., but investor activity varies significantly across markets. Adapting a metric commonly used for measuring the return on investment for commercial real estate can help identify the most attractive markets for residential real estate investors.
“Where cap rates are high and rent growth is strong, we are likely to see continued interest from investors in single-family housing.”
Housing’s Investment Return
Investors in commercial real estate often use a concept called the capitalization rate (cap rate) to calculate their potential rate of return on a real estate investment. The cap rate measures the net operating income of a property – its rental income less any operating costs, such as property taxes, insurance, and maintenance and repair costs – compared to the value of the property. Similar to the yield on a bond or the rate of return on an investment, the higher the cap rate, the more profitable the investment. While commonly calculated for commercial real estate transactions, it can be applied to residential real estate as well.
To calculate the typical market-level residential cap rate, take the median residential market rent and assume that the property will be vacant for three of the 12 months of the year (the typical vacancy assumption mortgage lenders use when underwriting a residential investment property), leaving an investor with nine months of collected rent. After accounting for property costs – property taxes, maintenance costs and annual homeowner’s insurance premium – we are left with estimated total rental income. Dividing the estimated total rental income by the median home sale price in each market yields a residential cap rate.
Which Markets Offer the Highest Return?
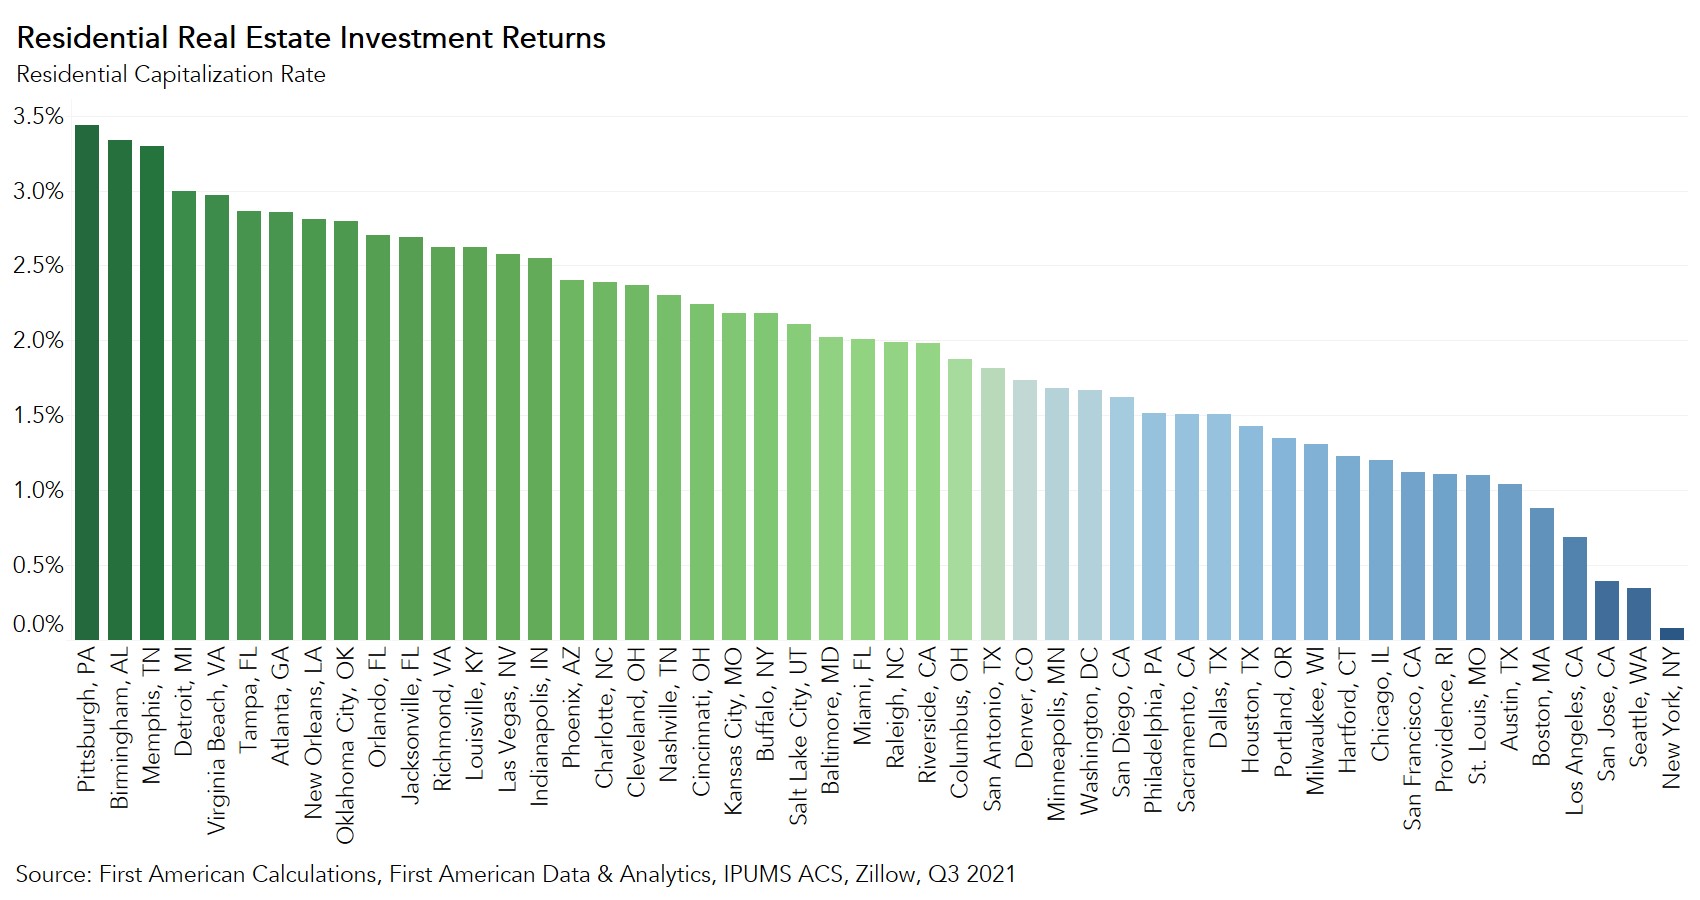
Breaking down the cap rate for the median single-family home in each of the top 50 U.S. markets reveals the residential housing markets that are potentially the most profitable from a real estate investment perspective. Of the top 50 U.S. markets, the five markets with the highest cap rates in the third quarter of 2021 were Pittsburgh (3.4 percent), Birmingham, Ala. (3.3 percent), Memphis, Tenn. (3.3 percent), Detroit (3 percent), and Virginia Beach, Va. (3 percent). The five markets with the lowest cap rates were New York (0.1 percent), San Jose, Calif. (0.3 percent), San Francisco (0.4 percent), Los Angeles (0.7 percent), and Boston (0.9 percent).
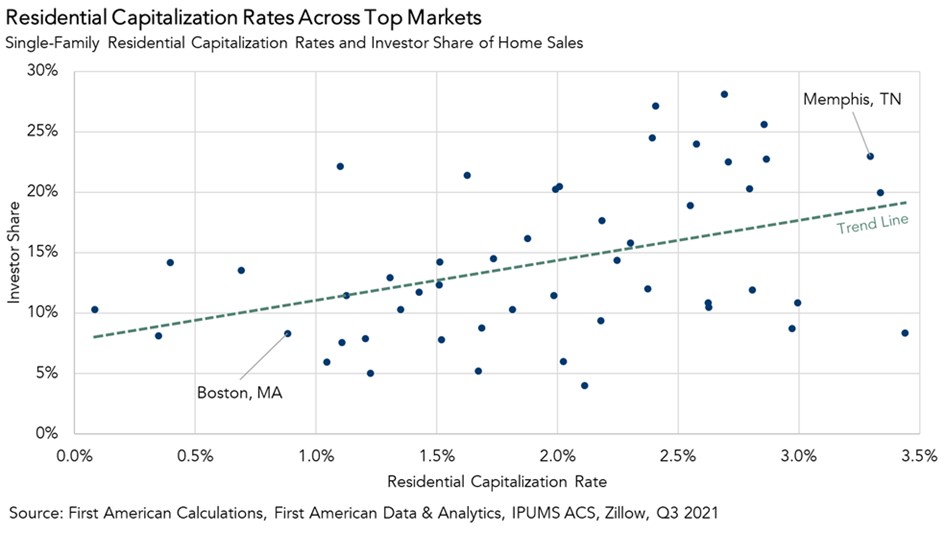
Markets with higher residential cap rates are more likely to have higher investor activity. For example, in the third quarter of 2021, Memphis had the third-highest cap rate in the top 50 markets and one of the highest shares of investor sales (the share of single-family homes purchased by a business entity) – 23 percent. Meanwhile, Boston had a cap rate of 0.9 percent and just over 8 percent of single-family home sales were investor purchases.
Some of the most affordable markets have the highest cap rates because home sale prices and property taxes are lower, while rent growth is strong. The average property tax rate among the top five highest cap rate markets was 0.8 percent, while the average property tax rate for the five lowest cap rate markets was 1 percent. Meanwhile, rent increased by over 8 percent in 2021 compared with 2020 for the top five markets, compared with only 1 percent in the bottom five markets.
Why the Shift to Investments in Single-Family Homes for Rent?
Investors in the real estate market have usually flocked to multifamily property investments rather than investments in single-family homes because the return on investment on multifamily properties is typically higher. According to Real Capital Analytics data, the multifamily cap rate in the top 50 U.S. markets ranged from 3.9 to 6.4 percent in the third quarter of 2021. While the return on investment on multifamily properties is higher, so is the risk. Historically, single-family housing has been a relatively safe asset with few periods of house price depreciation. For an investor, the slightly lower cap rate in exchange for a safer asset makes economic sense. Where cap rates are high and rent growth is strong, we are likely to see continued interest from investors in single-family housing.
Methodology
Residential capitalization rates for the top 50 U.S. markets in this analysis are derived by dividing net operating income (rental income less operating expenses) over market value. To calculate rental income, median rent is derived from the 2019 American Community Survey microdata, the latest year available, and extrapolated to Q3 2021 using the Zillow Observed Rent Index. Based on typical underwriting guidelines, 25 percent of gross rent is assumed to be absorbed by vacancy losses and maintenance expenses. We then subtract other operating expenses, including property taxes derived from First American Data & Analytics’ market-level property tax rate data and an annual homeowner’s insurance premium assumed to be 0.4 percent of the home value. The resulting net operating income is divided by the average of the median single-family home sale price in each market in Q3 2021.
Ksenia Potapov contributed to this blog post.


