Two of the three key drivers of the Real House Price Index (RHPI), nominal house prices and mortgage rates, dragged affordability lower in June. The 30-year, fixed mortgage rate increased by 0.3 percentage points and nominal house prices accelerated by 0.8 percent compared with May. While household income increased by 0.4 percent, it was not enough to offset the affordability-dampening impact from higher mortgage rates and prices. Consumer house-buying power declined by nearly $9,000 compared with May and remains $32,000 lower than one year ago. The outlook for house-buying power is heavily dependent on the path for mortgage rates, and that path is highly uncertain.
“It’s likely that mortgage rates continue to hover in the 6.5-to-7.5 percent range for the remainder of the year, which means affordability will remain a challenge for many home buyers.”
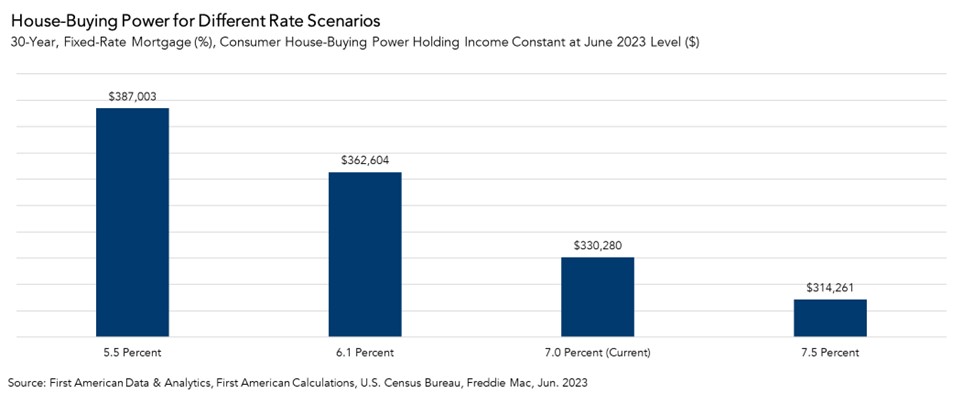
How High Will Mortgage Rates Go?
We can use the RHPI to model shifts in income and mortgage rates to see how they impact consumer house-buying power or affordability. Rising incomes and falling mortgage rates each boost house-buying power, while falling incomes and rising mortgage rates each sap house-buying power.
As of mid-August, the average mortgage rate nationally sits at approximately 7 percent. In June of last year, the average mortgage rate nationally was roughly 5.5 percent. Holding incomes constant at their June 2023 level and assuming a 5 percent down payment, the increase in mortgage rates alone reduced house-buying power by nearly $57,000. An average of several industry forecasts projects that mortgage rates will end the year lower, at 6.1 percent. If those forecasts are correct and the average mortgage rate decreases from the 7 percent level to 6.1 percent, house-buying power increases by nearly $32,000. However, if mortgage rates drifted upward to 7.5 percent, house-buying power would fall by $16,000.
Uncertain Outlook for Mortgage Rates
The popular 30-year, fixed mortgage rate is loosely benchmarked to the 10-year Treasury bond. Since the end of the Great Recession, the 30-year, fixed mortgage rate has on average remained 1.7 percentage points (170 basis points) higher than the 10-year Treasury bond yield. The spread usually widens during periods of economic or geopolitical uncertainty, as is the case in today’s market.
As the industry forecasts predict, it’s reasonable to assume that the spread and, therefore, mortgage rates will moderate later in the year if the Federal Reserve stops further monetary tightening and provides investors with more certainty. However, it’s unlikely that mortgage rates will revert to the 5.5 percent levels of 2022 until inflation has moved closer to the Federal Reserve’s 2 percent target and it begins loosening monetary policy, or there’s a significant economic downturn. A likely scenario is that mortgage rates continue to hover in the 6.5-to-7.5 percent range for the remainder of the year, which means affordability will remain a challenge for many home buyers.
For more analysis of affordability, please visit the Real House Price Index.
The RHPI is updated monthly with new data. Look for the next edition of the RHPI the week of September 25, 2023.
[1] The RHPI for non-disclosure states and markets that fall within non-disclosures states are not included in this month’s RHPI report.
Sources:
June 2023 Real House Price Index Highlights
The First American Real House Price Index (RHPI) showed that in June 2023:
- Real house prices increased 3.4 percent between May 2023 and June 2023.
- Real house prices increased 12.4 percent between June 2022 and June 2023.
- Consumer house-buying power, how much one can buy based on changes in income and mortgage rates, decreased 2.6 percent between May 2023 and June 2023, and decreased 8.6 percent year over year.
- Median household income has increased 3.8 percent since June 2022 and 82.7 percent since January 2000.
- Real house prices are 41.1 percent more expensive than in January 2000.
- Unadjusted house prices are now 52.2 percent above the housing boom peak in 2006, while real, house-buying power-adjusted house prices are 1.3 percent below their 2006 housing boom peak.
June 2023 Real House Price State[1] Highlights
- The five states with the greatest year-over-year increase in the RHPI are: Connecticut (+21.4 percent), New Hampshire (+20.8 percent), Wisconsin (+19.6 percent), Illinois (+18.6 percent), and Virginia (+18.6 percent).
- There were no states with a year-over-year decrease in the RHPI.
June 2023 Real House Price Local Market Highlights
- Among the Core Based Statistical Areas (CBSAs) tracked by First American, the five markets with the greatest year-over-year increase in the RHPI are: Miami (+22.3 percent), Buffalo (+20.0 percent), Chicago (+19.8 percent), Boston (+19.7 percent), and Milwaukee (+19.3 percent).
- Among the Core Based Statistical Areas (CBSAs) tracked by First American, there were no markets with a year-over-year decrease in the RHPI.
The traditional perspective on house prices is fixated on the actual prices and the changes in those prices, which overlooks what matters to potential buyers - their purchasing power, or how much they can afford to buy. First American’s proprietary Real House Price Index (RHPI) adjusts prices for purchasing power by considering how income levels and interest rates influence the amount one can borrow.
The RHPI uses a weighted repeat-sales house price index that measures the price movements of single-family residential properties by time and across geographies, adjusted for the influence of income and interest rate changes on consumer house-buying power. The index is set to equal 100 in January 2000. Changing incomes and interest rates either increase or decrease consumer house-buying power. When incomes rise and mortgage rates fall, consumer house-buying power increases, acting as a deflator of increases in the house price level. For example, if the house price index increases by three percent, but the combination of rising incomes and falling mortgage rates increase consumer buying power over the same period by two percent, then the Real House Price index only increases by 1 percent. The Real House Price Index reflects changes in house prices, but also accounts for changes in consumer house-buying power.
Disclaimer
Opinions, estimates, forecasts and other views contained in this page are those of First American’s Chief Economist, do not necessarily represent the views of First American or its management, should not be construed as indicating First American’s business prospects or expected results, and are subject to change without notice. Although the First American Economics team attempts to provide reliable, useful information, it does not guarantee that the information is accurate, current or suitable for any particular purpose. © 2023 by First American. Information from this page may be used with proper attribution.


