In June 2022, the Real House Price Index (RHPI) jumped up by 53.3 percent on an annual basis, setting a new record for the fifth month in a row for the fastest year-over-year growth in the more than 30-year history of the series. This rapid annual decline in affordability was driven by an 18.5 percent annual increase in nominal house prices and a 2.5 percentage point increase in the 30-year, fixed mortgage rate compared with one year ago. Even though household income increased an impressive 4.7 percent since June 2021, it was not enough to offset the affordability loss from higher mortgage rates and fast-rising nominal prices.
“There remains a structural and long-term national supply shortage in the housing market, but in some cities the pullback in demand is strong and inventory is rising faster, resulting in a greater moderation of house price growth.”
As affordability wanes, would-be buyers are pulling back from the market, reducing competition for homes and prompting annual house price appreciation to moderate. Nationally, annual house price growth peaked in March at nearly 21 percent, but has since decelerated slightly to a still-robust 18.5 percent in June. However, the modest price deceleration is not a national phenomenon. While house price growth has slowed in all top 50 markets we track, the pace of moderation varies significantly by market.
The Great House Price Moderation
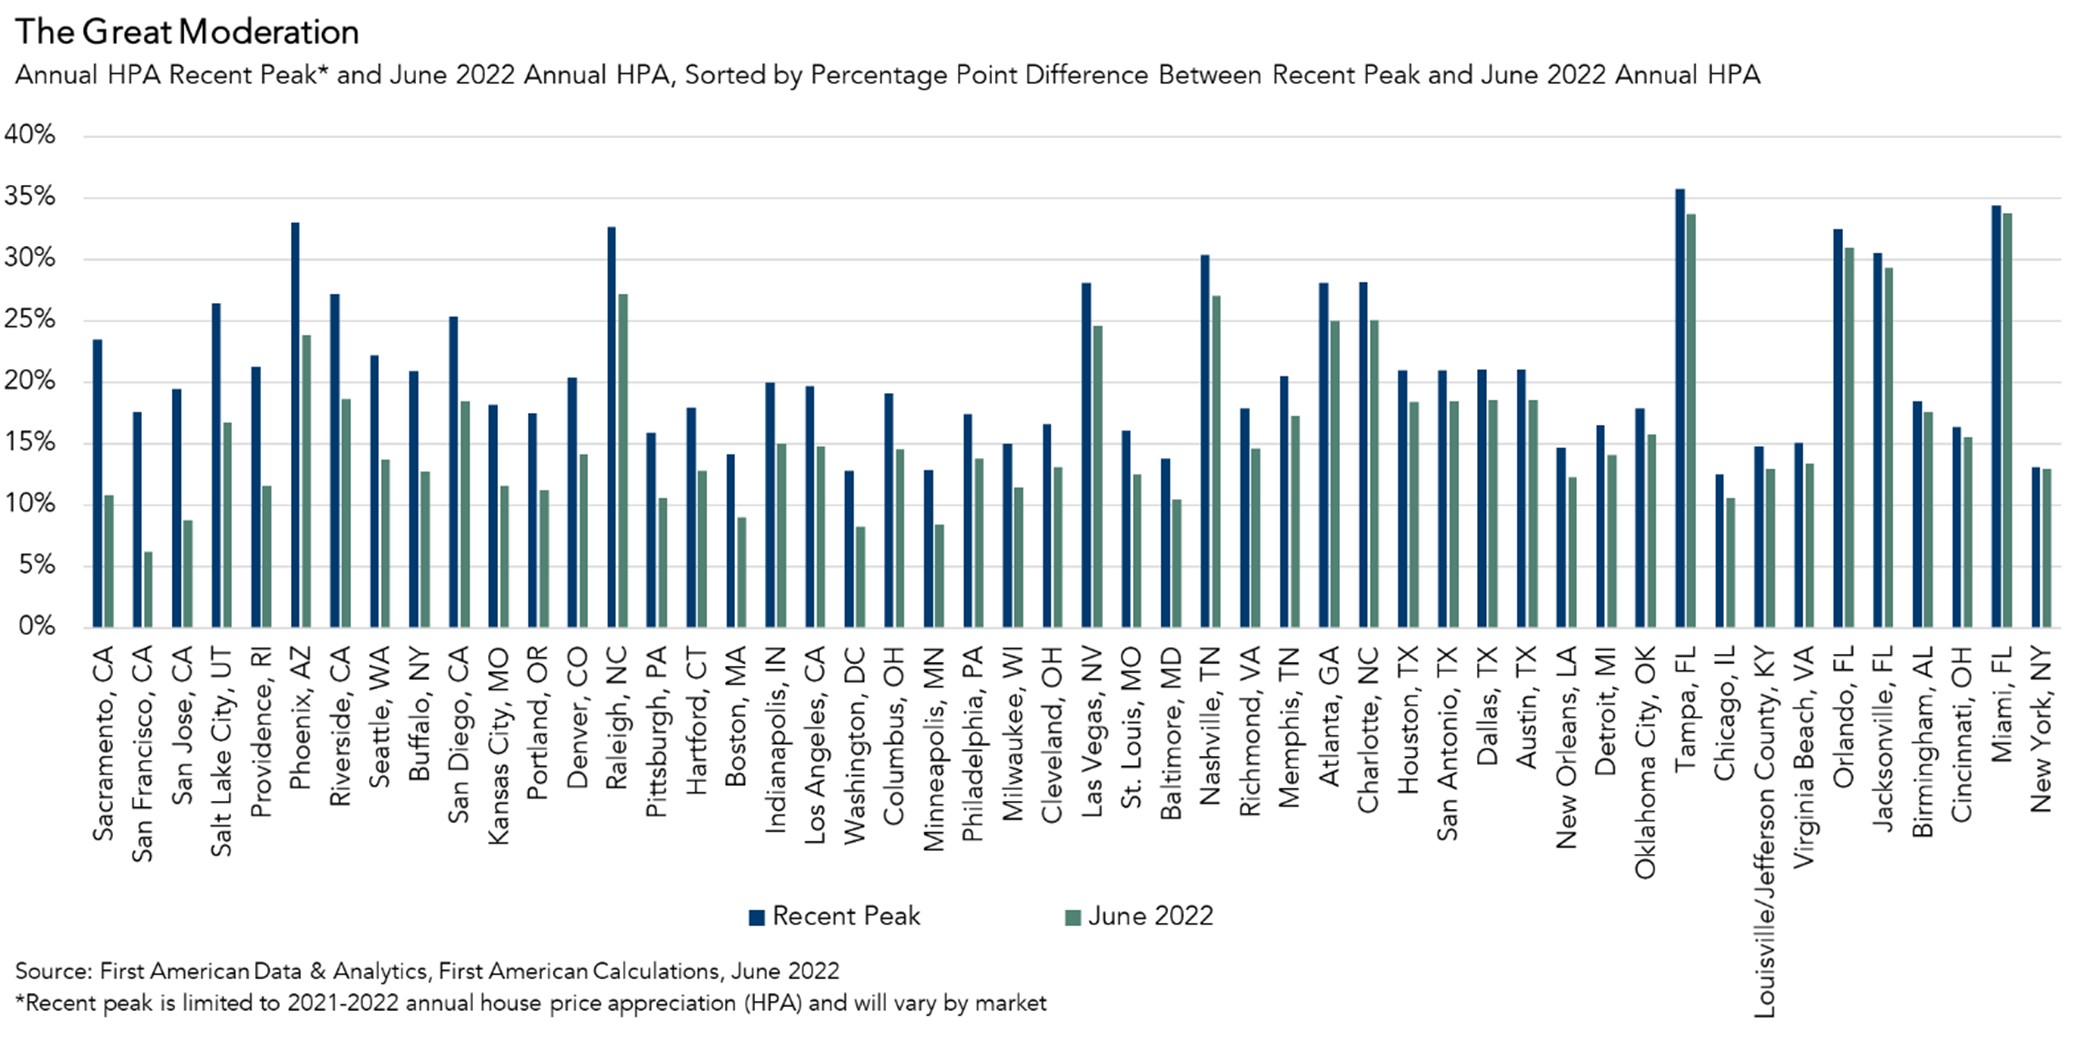
While all top 50 markets are pulling back from their respective peaks in price appreciation, some markets have decelerated faster than others. The chart below shows annual house price appreciation at the 2021-2022 peak for each respective market, and the pace of growth in June 2022. The markets are rank-ordered from the largest to the smallest percentage point difference between the recent peak for that market and the corresponding June 2022 house price appreciation rate.
For example, the market with the strongest deceleration was Sacramento, Calif. In Sacramento, annual house price appreciation peaked in July 2021 at 23.5 percent, but has since slowed to 10.8 percent. The market with the smallest gap, on the other hand, was New York. House price appreciation in New York did not accelerate as fast as in other markets and was well below the national peak, only reaching 13 percent on an annual basis at its peak in May 2021 and it remains at nearly that same pace in June. The market with the slowest annual pace of price appreciation in June was San Francisco at 6.2 percent, down significantly from its July 2021 pace of 17.5 percent. Conversely, the market with the fastest pace of appreciation in June was Miami at 33.8 percent, which is nearly the same pace as its peak of 34.4 percent in May 2022.
The record-breaking house price appreciation nationwide and across markets in 2021 and early 2022 was due to a supply and demand imbalance – too much demand, too little supply. There remains a structural and long-term national supply shortage in the housing market, but in some cities the pullback in demand is strong and inventory is rising faster, resulting in a greater moderation of house price growth.
For more analysis of affordability, please visit the Real House Price Index. The RHPI is updated monthly with new data. Look for the next edition of the RHPI the week of September 26, 2022.
Sources:
June 2022 Real House Price Index Highlights
The First American Real House Price Index (RHPI) showed that in June 2022:
- Real house prices increased 3.7 percent between May 2022 and June 2022.
- Real house prices increased 53.3 percent between June 2021 and June 2022.
- Consumer house-buying power, how much one can buy based on changes in income and interest rates, decreased 2.8 percent between May 2022 and June 2022, and decreased 22.7 percent year over year.
- Median household income has increased 4.7 percent since June 2021 and 72.5 percent since January 2000.
- Real house prices are 32.9 percent more expensive than in January 2000.
- While unadjusted house prices are now 54.8 percent above the housing boom peak in 2006, real, house-buying power-adjusted house prices remain 6.4 percent below their 2006 housing boom peak.
June 2022 Real House Price State Highlights
- The five states with the greatest year-over-year increase in the RHPI are: Florida (+75.6), South Carolina (+63.7 percent), Georgia (+61.6), North Carolina (+61.5 percent), and Arizona (+60.2 percent).
- There were no states with a year-over-year decrease in the RHPI.
June 2022 Real House Price Local Market Highlights
- Among the Core Based Statistical Areas (CBSAs) tracked by First American, the five markets with the greatest year-over-year increase in the RHPI are: Tampa, Fla. (+70.6 percent), Charlotte, N.C. (+69.8), Raleigh, N.C. (+69.6 percent), Miami (+68.4 percent) and Orlando (+66.4 percent).
- Among the Core Based Statistical Areas (CBSAs) tracked by First American, there were no markets with a year-over-year decrease in the RHPI.
About the First American Real House Price Index
The traditional perspective on house prices is fixated on the actual prices and the changes in those prices, which overlooks what matters to potential buyers - their purchasing power, or how much they can afford to buy. First American’s proprietary Real House Price Index (RHPI) adjusts prices for purchasing power by considering how income levels and interest rates influence the amount one can borrow.
The RHPI uses a weighted repeat-sales house price index that measures the price movements of single-family residential properties by time and across geographies, adjusted for the influence of income and interest rate changes on consumer house-buying power. The index is set to equal 100 in January 2000. Changing incomes and interest rates either increase or decrease consumer house-buying power. When incomes rise and mortgage rates fall, consumer house-buying power increases, acting as a deflator of increases in the house price level. For example, if the house price index increases by three percent, but the combination of rising incomes and falling mortgage rates increase consumer buying power over the same period by two percent, then the Real House Price index only increases by 1 percent. The Real House Price Index reflects changes in house prices, but also accounts for changes in consumer house-buying power.
Disclaimer
Opinions, estimates, forecasts and other views contained in this page are those of First American’s Chief Economist, do not necessarily represent the views of First American or its management, should not be construed as indicating First American’s business prospects or expected results, and are subject to change without notice. Although the First American Economics team attempts to provide reliable, useful information, it does not guarantee that the information is accurate, current or suitable for any particular purpose. © 2022 by First American. Information from this page may be used with proper attribution.


