The shutdown of large discretionary consumption segments of the U.S. economy, with the intent to slow and prevent the spread of COVID-19, has triggered one of the fastest contractions in U.S. economic activity ever observed. As a result, millions of Americans have filed for jobless benefits and the unemployment rate rose to 14.7 percent in April, the highest rate since the U.S. Bureau of Labor Statistics began tracking it in 1948. Economic hardship, particularly a negative income shock and high unemployment, can diminish the number of potential home buyers in the market. Yet, there is reason to believe that the pool of potential home buyers may not shrink as much as the jobless claims and unemployment rate may suggest.
“Yet, there is reason to believe that the pool of potential home buyers may not shrink as much as the jobless claims and unemployment rate may suggest.”
Examining the Unemployment Rate by Tenure Choice
The unemployment rate is often used as a proxy for the extent of economic hardship. The more households with unemployed members, the higher the aggregate level of economic hardship in the economy. However, it is important to distinguish between renters and homeowners when analyzing who this labor market decline will disproportionally hurt.
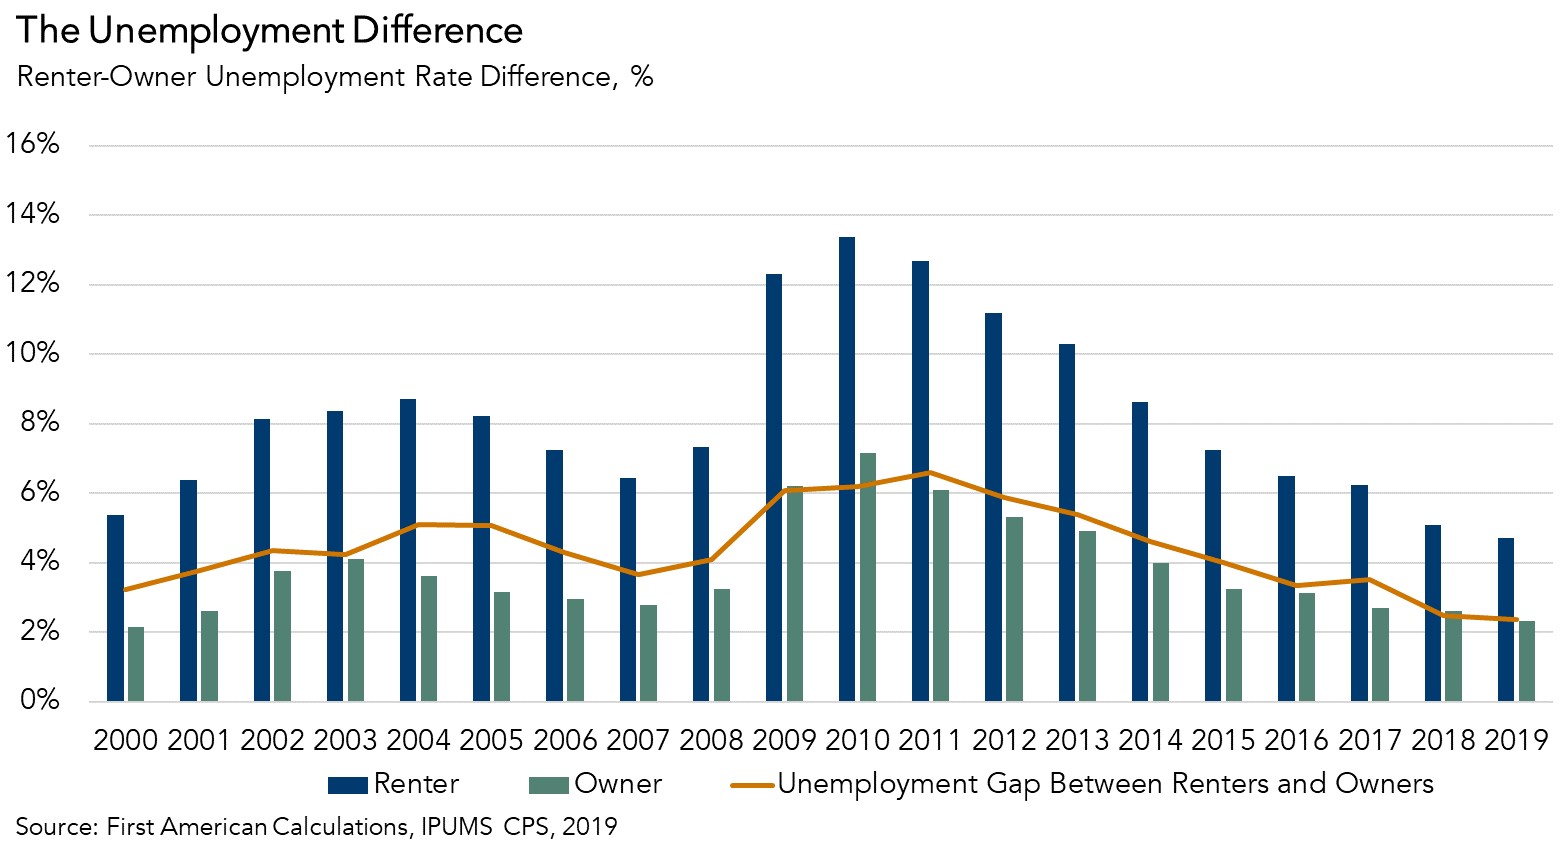
The figure below shows the difference in the unemployment rate between homeowners and renters since 2000. Homeowners are less likely to be unemployed overall and, in times of economic distress, the rate of unemployment among homeowners increases less dramatically than the rate among renters. In fact, since 2000, the unemployment rate among renters has exceeded the rate among homeowners by an average of 4.4 percentage points. The unemployment rate gap widened during and in the aftermath of the Great Recession, remaining 6 percentage points or above from 2009 until peaking at 6.6 percentage points in 2011 before descending and reaching a low point of 2.4 percentage points in 2019.
Homeowners are less likely to be unemployed, largely because homeownership is highly correlated with being older and more educated, which also reduces the likelihood of being unemployed. Our analysis of anonymized household-level survey data shows that homeowners are 4.8 percent less likely to be unemployed, all else equal. The likelihood of being unemployed is also 3.1 percent lower if you have a bachelor’s degree versus a high school diploma, and 4.4 percent lower for a 35-year-old versus a 25-year-old. Unemployment risk is greatest for younger renters without a college education.
The pandemic recession may even further exacerbate the divide because it is a health-crisis-driven service sector consumption contraction. Typically, recessions are driven by contractions in business sector capital expenditure. Analysis of April’s unemployment report highlights this point. Of the total 20.5 million jobs lost, 7.7 million (37 percent) were in the leisure and hospitality sector, and of those, the majority (approximately 72 percent) were in food service, where 5.5 million chefs, waiters and cashiers lost jobs.
Given the heavy toll taken by this consumption-reliant part of the economy, it’s no surprise that younger and less educated workers are disproportionally represented in the newly unemployed. The unemployment rate increased the most for those between 16-24 years old. Among those without a high school degree, the unemployment rate increased by 14.4 percentage points, while the rate increased by less than half that amount, 5.9 percent, among those with a college degree or higher. The young and less educated are clearly more impacted by the service sector consumption contraction, but the young and less educated are also less likely to be homeowners or potential home buyers.
Homeownership Among the COVID-19 Vulnerable
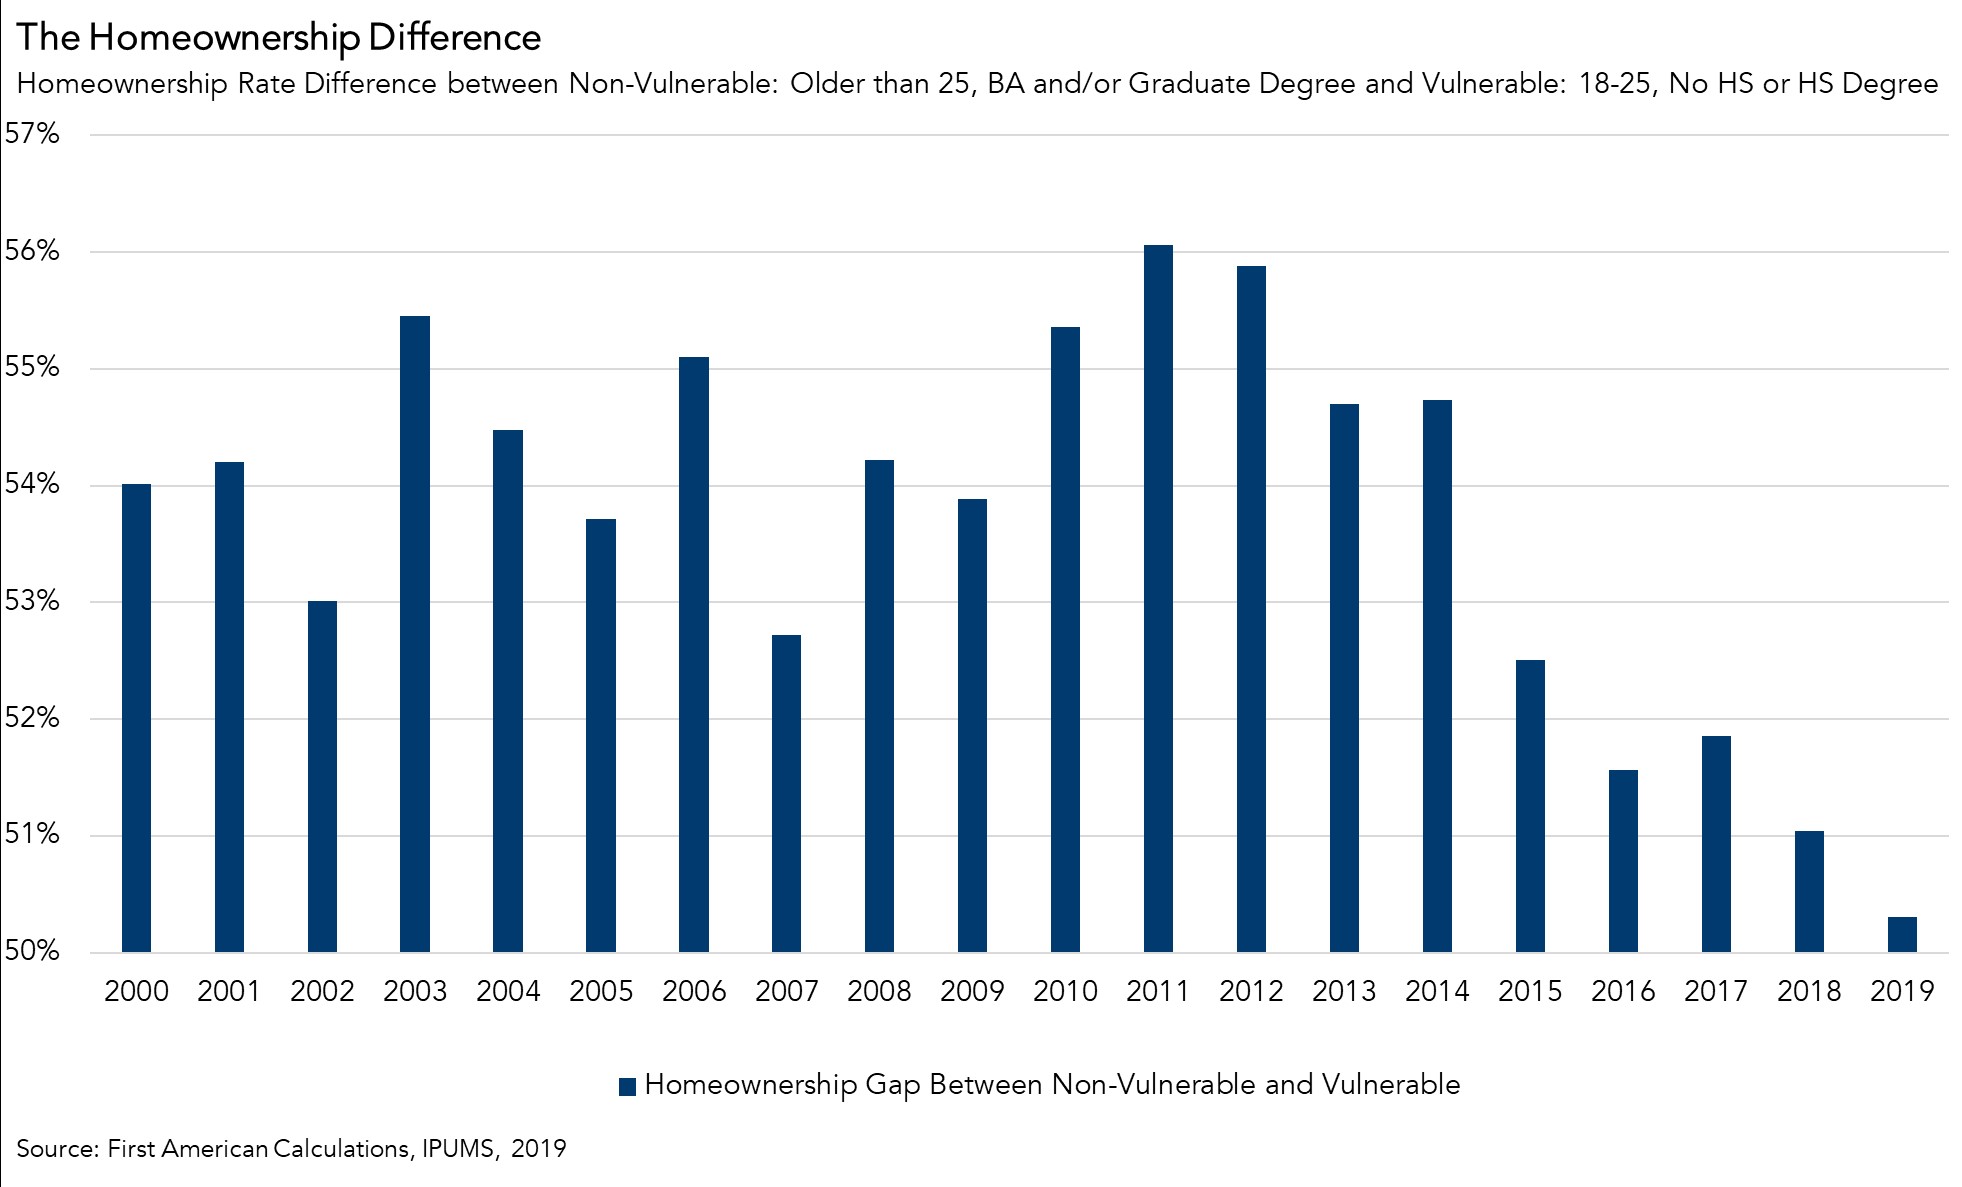
We can examine the homeownership rate among those most vulnerable to the service sector-driven job losses. We classify a ‘COVID-19 vulnerable’ household as under 25 years old with less than a college degree educational attainment level. Using the anonymized household level data, it is possible to profile the homeownership rate over time for the COVID-19 vulnerable versus everyone over the age of 25 with a college degree or higher educational attainment level.
The average homeownership rate difference for the non-vulnerable versus the vulnerable group is nearly 54 percent. That difference is lower now than its historical average, but the data shows that the gap tends to grow during times of economic distress. While it is possible that larger scale layoffs will begin to hit other sectors, the current share of homeowners and would-be home buyers among those who have been laid off is smaller than that of the general population.
While this analysis does not specifically focus on the hardships faced by renter households, recent studies confirm that renters will be disproportionally hurt by the economic downturn. The purchase market will not go unscathed, as demand has slowed due to the economic uncertainty and labor market decline. Yet, historically low mortgage rates have brought some prospective home buyers back into the market, as evidenced by the fourth straight week of rising purchase applications. Our analysis shows that the nature of this service sector-driven recession is unlikely to result in a one-to-one decline in homeownership demand because those being impacted disproportionately by this recession are much less likely to have been house hunting in the first place. In fact, the data indicates that homeownership demand may be delayed, but it’s not dead.


