In the fourth quarter of 2020, the median renter experienced a 10 percent boost to their house-buying power relative to one year ago, but the share of homes they could afford to buy declined by 4 percentage points due to rising house prices, according to the First-Time Home Buyer Outlook Report. However, while we recently examined affordability for the median renter nationally and in each of the top 50 U.S. markets, many households earn less than the median income in their respective city. Using the same analysis, it is possible to identify cities where renters with lower household income levels may have a greater opportunity to pursue the dream of homeownership.
“There are cities where the dream of homeownership for lower income renters may be more attainable than many realize.”
Nationally, just like renters with median incomes, renters in the 30th percentile (lower-income households) saw their house-buying power increase by 10 percent in the fourth quarter of 2020, but the share of affordable supply declined from 31 to 27 percent. The national snapshot, however, obscures the differences in affordability from market to market.
Affordability Equilibrium Varies Greatly by City
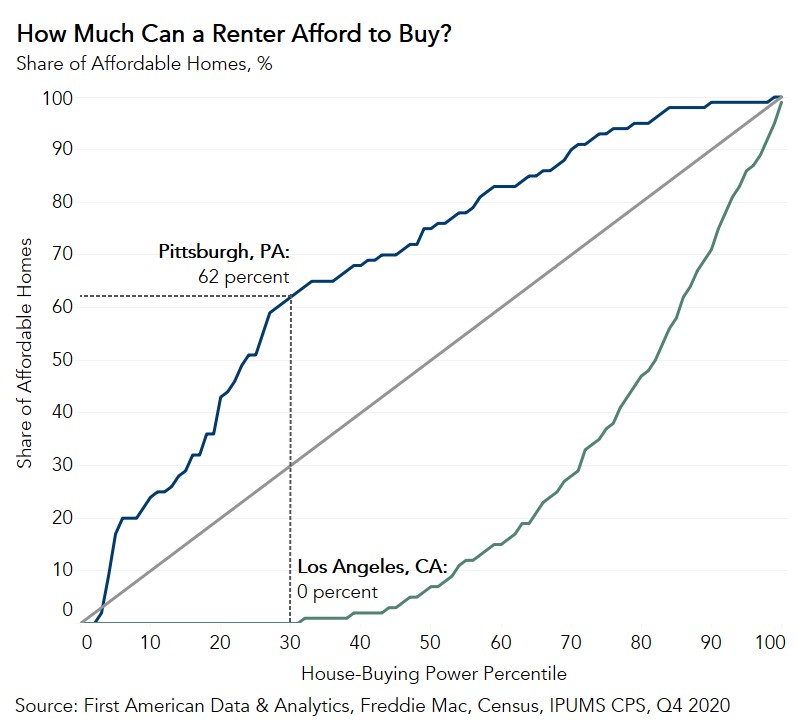
Where a renter sits in the house-buying power distribution greatly influences the supply of affordable homes they can afford. The graph below visualizes this dynamic as it identifies the share of homes for sale in the market that are affordable relative to the point at which each household is situated in that market’s renter income distribution. The 45-degree line running through the middle of the chart represents renter affordability equilibrium. Along this line, each household in the renter income distribution can afford an equal share of homes for sale in their market. Renter households above the renter affordability equilibrium line can afford more than their “share” of homes for sale and those below can afford less.
An example of an unaffordable market to the lower-income renter household is Los Angeles. In Los Angeles, a lower-income renter household had a house-buying power of $215,200 in the fourth quarter of 2020 and could afford none of the homes for sale. On the other hand, in Pittsburgh, a very affordable city, the lower-income renter household has less house-buying power, $185,000, but could afford 62 percent of the homes for sale in the fourth quarter of 2020.
The Most Affordable Markets for Lower Income Households
This analysis can be used to identify the cities where renters with lower household income levels have the greatest opportunity to pursue the dream of homeownership. Below is a list of cities where lower-income renter households could find the largest share of affordable homes in the fourth quarter of 2020:
- Pittsburgh: 62 percent
- Oklahoma City: 57 percent
- Kansas City, Mo.: 48 percent
- Louisville, Ky.: 44 percent
- Columbus, Ohio: 44 percent
Meanwhile, the cities where lower-income renter households had the smallest share of affordable homes were:
- Los Angeles: 0 percent
- San Francisco: 1 percent
- San Jose, Calif.: 2 percent
- Providence, R.I.: 3 percent
- Sacramento, Calif.: 3 percent
Affordability is determined by the share of homes for sale that are within a renter’s house-buying power. While the dollar amount of renter house-buying power in a place like Los Angeles is high relative to other cities, the share of homes that are within reach given one’s house-buying power is limited. Conversely, renters in Pittsburgh have $30,000 less in house-buying power than renters in Los Angeles, but can afford a dramatically larger share of homes, making it an affordable market.
A national snapshot of housing affordability is insufficient given the old adage that real estate is local. There are cities where the dream of homeownership for lower income renters may be more attainable than many realize. Looking at the complete house-buying power distribution of renter households reveals that cities like Pittsburgh, Oklahoma City, and Kansas City provide even lower income renters with a large supply of homes they can afford.
Ksenia Potapov contributed to this blog post.
About the First-Time Home Buyer Outlook Report
Housing affordability is often measured as the median household income relative to the income needed to purchase the median-priced home. And it is often the case that the relative rates of change in house prices and income is synonymous with a change in affordability. This overlooks what matters to potential buyers – their house-buying power, or how much they can afford to buy. First American’s proprietary First-Time Home Buyer Outlook Report examines first-time home buyer house-buying power by considering how mortgage rates, renter income levels, PMI, and property taxes influence the amount one can afford to buy and the share of homes for sale that are affordable at each point in the house-buying power distribution.
First-time home buyer house-buying power is based on median renter’s income, the prevailing 30-year, fixed mortgage rate, the most recent year’s property tax rate for the geography of the renter, and assumes a fixed cost for private mortgage insurance, a 5 percent down payment and that one-third of their pre-tax income is used for the mortgage. First-time home buyer house-buying power can then be used to identify the share of the homes for sale the first-time home buyer could afford to buy. As a measure of affordability, the higher the share of homes for sale that first-time home buyers can afford to buy, the more affordable the market.