In 2020, a combination of record low mortgage rates and millennials aging into homeownership boosted demand against a very limited supply of homes for sale, resulting in rapid house price appreciation. The nearly two-thirds of American households who already own homes saw their equity increase, while potential first-time home buyers, who are nearly always renters, missed out. While low mortgage rates increase house-buying power and thus improve affordability for potential first-time buyers, low rates also boost demand and, in a supply-restricted market, accelerate house price appreciation, which in turn reduces affordability. Nationally in 2020, this tug-of-war resulted in higher purchasing power, but a smaller share of affordable homes for first-time buyers.
“Affordability is better defined as the share of homes for sale that are within the renter’s house-buying power.”
Renter House-Buying Power Increased 10 Percent Compared With One Year Ago
From the perspective of a potential first-time home buyer, affordability is a function of two things: house-buying power and the share of affordable homes available for sale. Our estimate of a first-time buyer’s house-buying power is based on the median renter’s income, the prevailing 30-year, fixed mortgage rate, and the assumption that one-third of the first-time home buyer’s pre-tax income is used for the mortgage. By comparing data on home sale transactions from First American Data & Analytics to the median renter’s house-buying power, we can estimate the share of homes for sale in any given market that are affordable for the median renter.
Nationally, the house-buying power of the median renter in the fourth quarter of 2020 jumped up 10 percent to $312,000 from $283,000 one year before. The increase is primarily the result of a significant drop in mortgage rates to a record monthly average low of 2.7 percent. While house-buying power increased, the share of homes for sale that a median renter could afford shrank nationally, falling to 57 percent in the fourth quarter of 2020, down from 61 percent one year ago. Even though house-buying power increased, house price appreciation eroded the affordability boost from falling mortgage rates.
The 10 Most Affordable Cities for First-Time Home Buyers
Of course, real estate is local. Nominal house prices vary dramatically by geography, so does household income – which creates regional differences in house-buying power. The markets with the greatest house-buying power are not necessarily the most affordable. Neither are the markets with the lowest nominal home prices. Affordable markets offer a sufficient share of homes for sale within the renter’s house-buying power. The larger the share of homes for sale that the renter can afford to buy, the more affordable the market.
Measuring affordability in this way, the chart below shows where the median renter can find the largest share of affordable homes among the 50 largest markets in the nation.
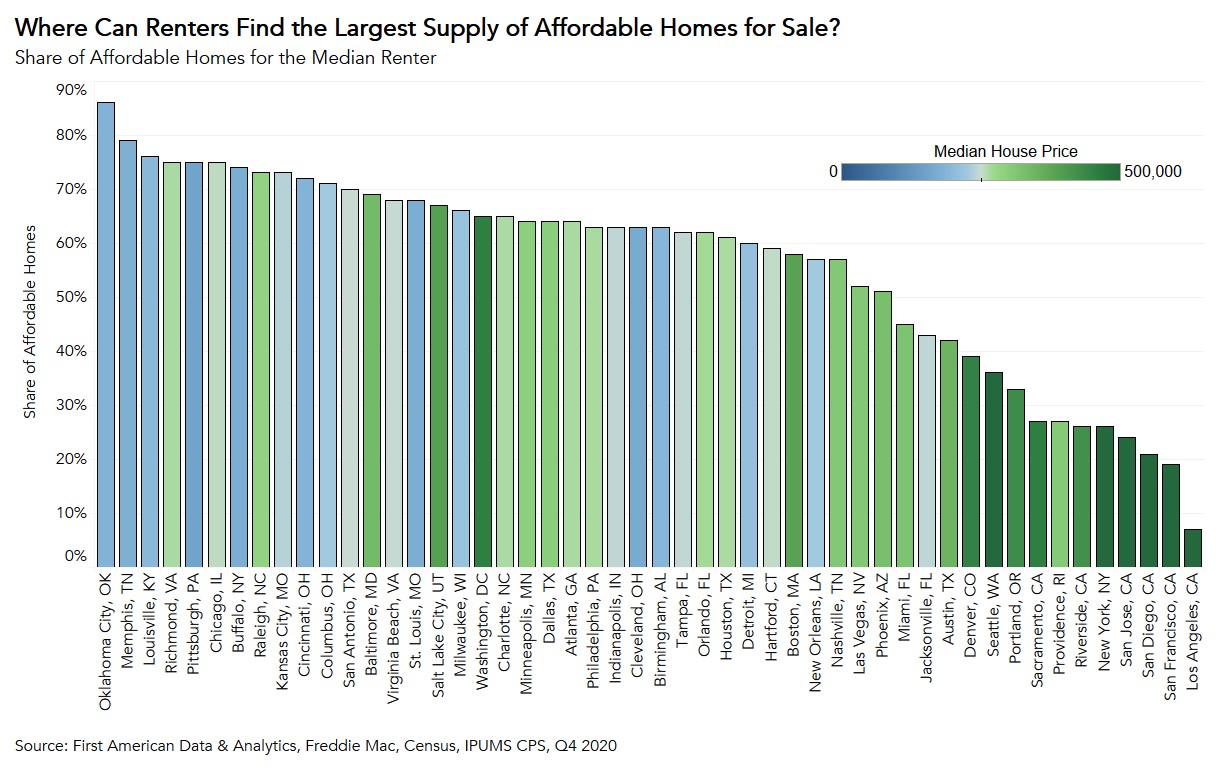
The most affordable city on the list is Oklahoma City, where the median renter could afford 86 percent of the homes for sale. In the fourth quarter of 2020, the median house price in Oklahoma City was $184,000 and the median renter’s house-buying power was $329,000.
By a considerable margin, the least affordable city is Los Angeles, where the median house price in the fourth quarter of 2020 was $737,000, but the median renter’s house-buying power of $373,000 left only 7 percent of the homes sold in Los Angeles actually affordable.
A Question of Supply
While coastal markets with high nominal home prices like Los Angeles, New York, and Seattle tend to be unaffordable, and markets with low home prices, like Oklahoma City, tend to be affordable, home prices alone do not make or break affordability. Instead, affordability is better defined as the share of homes for sale that are within the renter’s house-buying power.
Data Sources:
About the First-Time Home Buyer Outlook Report
Housing affordability is often reduced to a comparison of household income to house prices. This overlooks what matters to potential buyers – their house-buying power. First American’s proprietary First-Time Home Buyer Outlook Report examines first-time home buyer affordability by considering the share of homes for sale that are within the renter’s house-buying power. The larger the share of homes for sale that first-time home buyers can afford to buy, the more affordable the market.
First-time home buyer house-buying power is based on the median renter household’s income, the prevailing 30-year, fixed mortgage rate, the most recent year’s property tax rate for the geography of the renter, and assumes a fixed cost for private mortgage insurance, a 5 percent down payment and that one-third of their pre-tax income is used for the mortgage. The share of homes for sale is based on First American Data & Analytics’ aggregation of publicly recorded home sales.
This quarter’s report introduced a change in methodology in calculating renter household income in order to account for pandemic-related data collection issues in the Current Population Survey. It was assumed that household income increased by 4.8 percent between 2018 and 2019, and subsequently decreased by 1.8 percent between 2019 and 2020. The assumptions are based on the average annual percent increase in median renter household income between 2013 and 2017 and the average annual percent decline in median renter household income over the two previous recessions, respectively. In addition, the income of households not paying rent in exchange for services (resident manager, caretaker, member of the military) was excluded. As a result, it should be noted that figures in previous releases of the report are not directly comparable with the current release.
Ksenia Potapov contributed to this blog post.