Recent economic data and comments by members of the Federal Open Market Committee (FOMC) all suggest that the chance of a rate increase this week after the FOMC meets is substantially higher than it was just a few weeks ago. Now that we are most likely in a rising rate environment, what does it mean for housing affordability?
In our most recent Real House Price Index (RHPI) release, we reported that national affordability declined over 6 percent in December compared with a year ago, largely due to the year-end increase in mortgage rates. We know that rising rates typically reduce affordability, but the stronger economy is also increasing income growth that helps consumers maintain affordability.
“Even as rates are increasing, there are many markets where a median income can purchase more than the median house.”
Our RHPI measures the level of house prices relative to how much one can afford to buy based on income and the mortgage interest rate. In other words, it tracks consumer house-buying power. For example, if the price-to-house-buying power ratio is 1.0, then the median sale price is equal to the amount one can buy based on the mortgage rate and the median income.[1]
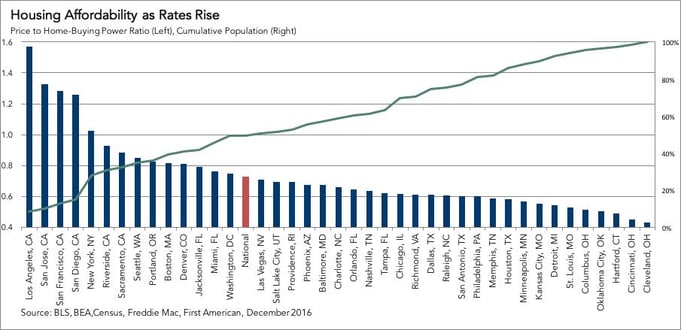
Simply put, a ratio below 1.0 means housing is more affordable and ratios above 1.0 mean they are less affordable, and the higher the ratio of house price to house-buying power, the less affordable housing is. Nationally, if the 30-year, fixed-rate mortgage increases to 4.75 percent because of an FOMC announcement, the price-to-house-buying power ratio will be 0.73.
Locally, even based on an expected higher mortgage rate, the amount of house one can afford is more than the typical house costs in most of the major markets we measure.
Here are the five most and least affordable markets in the country:
Most Affordable:
|
City |
Median Income |
Median Sale Price |
Price to House-Buying Power Ratio |
|
Cleveland, OH |
$53,332 |
$127,607 |
0.43 |
|
Cincinnati, OH |
$58,099 |
$145,794 |
0.45 |
|
Hartford, CT |
$77,509 |
$211,417 |
0.49 |
|
Oklahoma City, OK |
$51,541 |
$144,472 |
0.51 |
|
Columbus, OH |
$58,985 |
$167,401 |
0.51 |
Least Affordable:
|
City |
Median Income |
Median Sale Price |
Price to House-Buying Power Ratio |
|
Los Angeles, CA |
$65,351 |
$568,877 |
1.57 |
|
San Jose, CA |
$114,401 |
$841,833 |
1.33 |
|
San Francisco, CA |
$96,130 |
$685,240 |
1.28 |
|
San Diego, CA |
$71,157 |
$495,986 |
1.26 |
|
New York, NY |
$76,071 |
$431,728 |
1.02 |
[1] Assumes 5 percent down-payment, 4.75 percent 30-year, fixed-rate mortgage, and 33 percent debt-to-income ratio.


