While 2018 was largely characterized by declining affordability, ending the year with a five percent yearly decline in house-buying power, this trend reversed sharply in early 2019. Moderating home prices, in conjunction with gains in household income and declining mortgage rates, boosted affordability for potential home buyers.
“What happens when increasing demand for homes meets a market with tight supply? A rebound in house price appreciation appears likely, so the home buyer power play may be short lived.”
Mortgage rates in January fell 0.18 percentage points compared with the previous month and household income increased 0.3 percent. The result? House-buying power increased 2.3 percent in January. Additionally, nominal house price appreciation in January sank to the slowest pace of growth since February 2015, according to the DataTree by First American’s House Price Index. As a result, real house prices fell 1.9 percent, the second largest monthly decline since April 2017.
Home Buyer Power Play: Rising Income, Lower Mortgage Rates, Slower House Price Appreciation
In January, three forces swung toward home buyers, boosting their power in the housing market.
- Income on the rise: The labor market continued to impress, as rising wages narrowed the gap between household income growth and house price appreciation. Annual hourly wage growth increased by 3.3 percent compared with a year earlier, and the labor market’s record streak of job gains continued. The rise in wage growth contributed to the 3.6 percent year-over-year growth in average household income. Compared with January 2018, the increase in household income helped mitigate the impact of rising mortgage rates, which increased from 4.03 to 4.46 percent since January 2018, and reduced consumer house-buying power by $19,000. The growth in household income, however, increased consumer house-buying power by $13,000.
- Rate Drop Continues: The year-over-year decline in house-buying power could have been worse. The decline in mortgage rates from 4.64 to 4.46 percent in January boosted house-buying power by an impressive $7,500. That means a home buyer with a 5 percent down payment and a mortgage rate of 4.46 percent saw their house-buying power increase from $365,600 to $373,100 in January just from the lower rates. The net effect of the affordability tug-of-war between increasing mortgage rates and income growth was a $6,000 decline in house-buying power, compared with January 2018.
- Real House Prices Fall: According to our RHPI, 42 of the 44 major markets we track experienced a monthly decline in their RHPI levels in January. The geographically widespread affordability benefits of lower mortgage rates and higher wages more than offset the affordability cost of nominal house price appreciation in January.
Overall, house-buying power increased to $374,200, an impressive $8,600 gain in January compared with the previous month.
A Short-Lived Power Play?
The decline in mortgage rates over the last two months and the positive impact from the strong job market and the demographic tailwind from the millennial generation aging into homeownership should translate into higher demand. According to the Mortgage Bankers Association, new home mortgage applications surged 43 percent in January compared with the previous month. As wages continue to grow and mortgage rates remain low going into spring, we except demand to rise further. What happens when increasing demand for homes meets a market with tight supply? A rebound in house price appreciation appears likely, so the home buyer power play may be short lived.
The RHPI is updated monthly with new data. Look for the next edition of the RHPI the week of April 29, 2019.
Sources:
January 2019 Real House Price Index Highlights
The First American Real House Price Index (RHPI) showed that in December 2019:
- Real house prices decreased 1.9 percent between December 2018 and January 2019.
- Real house prices increased 7.0 percent year over year.
- Consumer house-buying power, how much one can buy based on changes in income and interest rates, increased 2.3 percent between December 2018 and January 2019, and declined 1.6 percent year over year.
- Average household income has increased 3.6 percent since January 2018 and 55.0 percent since January 2000.
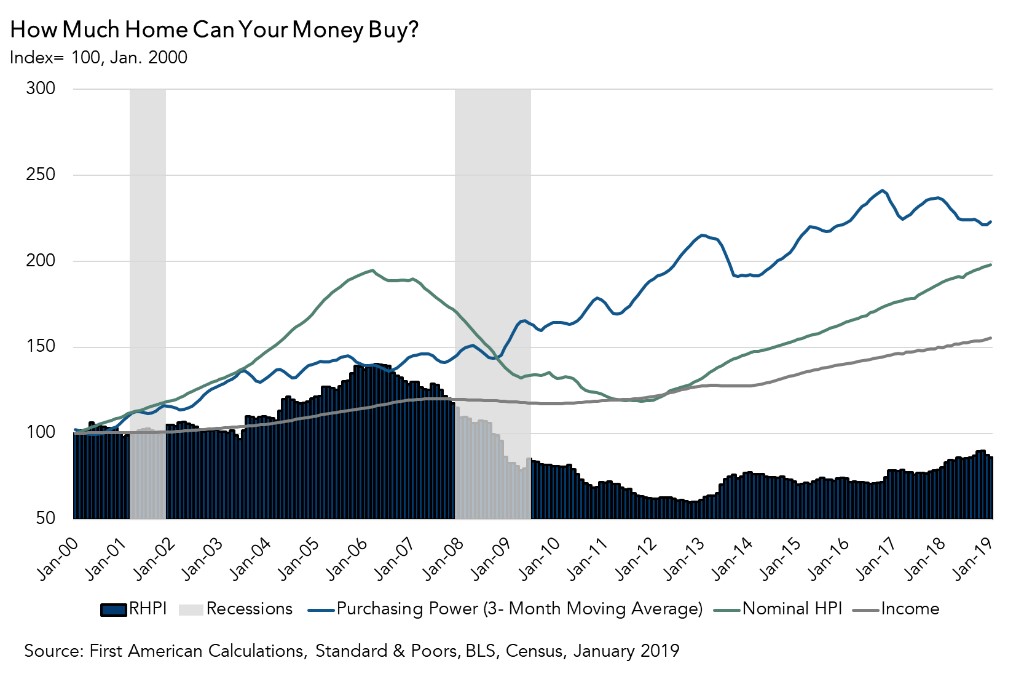
- Real house prices are 14.0 percent less expensive than in January 2000.
- While unadjusted house prices are now 1.6 percent above the housing boom peak in 2006, real, house-buying power-adjusted house prices remain 38.8 percent below their 2006 housing boom peak.
January 2019 Real House Price State Highlights
- The five states with the greatest year-over-year increase in the RHPI are: Rhode Island (+15.2 percent), New Hampshire (+12.0 percent), Wisconsin (+11.8 percent), Georgia (+11.0 percent), and Alaska (+10.8 percent).
- The only state with year-over-year decline in the RHPI is: Wyoming (-1.9 percent).
January 2019 Real House Price Local Market Highlights
- Among the Core Based Statistical Areas (CBSAs) tracked by First American, the five markets with the greatest year-over-year increase in the RHPI are: Providence, R.I. (+17.3 percent), Columbus, Ohio (+14.3 percent), Salt Lake City (+13.6 percent), Orlando, Fla. (+13.5 percent), and Atlanta (+12.5 percent).
- No CBSA had a year-over-year decrease in the RHPI in December.
Deputy Chief Economist Odeta Kushi contributed to this post.


