Two of the three key drivers of the Real House Price Index (RHPI), household income and mortgage rates, swung in favor of increased affordability in April. The 30-year, fixed-rate mortgage fell by 0.33 percentage points and household income increased 2.7 percent compared to April 2018. When household income rises, consumer house-buying power increases. Declining mortgage rates have a similar impact on affordability, so in April home buyers received a double shot of house-buying power to jolt affordability in their favor nationally.
“The intricate dance between house-buying power and nominal house price appreciation determines the direction and pace of affordability trends.”
Only nominal house price appreciation, which began to pick up the pace in April, dampened affordability. Declining mortgage rates have encouraged demand by increasing house-buying power, however, when demand increases for a scarce (limited or low supply) good, prices will rise faster. In April, the rate of year-over-year nominal house price appreciation increased to 5.9 percent, compared with 5.8 percent in March.
Despite the increasing rate of nominal house price appreciation, which makes homes less affordable, the consumer house-buying power gains were strong enough to win the affordability tug-of-war. Indeed, the RHPI, which adjusts nominal house prices based on changes in income and interest rates, decreased 0.72 percent compared with one year ago. The last time real house prices declined was in October 2016.
The Five Cities Where Affordability Increased the Most
While affordability improved nationally, real estate is all about “location, location, location.” Of the 44 markets we track, affordability improved in 43 of them month-over-month, and affordability improved in 18 markets on a year-over-year basis. The five markets with the highest year-over-year growth in affordability are:
- San Jose, Calif.
- Seattle
- Portland, Ore.
- San Francisco
- Los Angeles
Breaking Down the Affordability Dynamic
Declining mortgage rates increase affordability equally in each market as mortgage rates are generally the same across the country. However, household income growth and nominal house prices vary by market, so the affordability dynamic varies as well. In fact, one reason why these markets have seen such strong gains in affordability is because household income growth was so strong. In the top four markets, household income growth exceeded house price growth. That’s an affordability boost even without the help of falling rates.
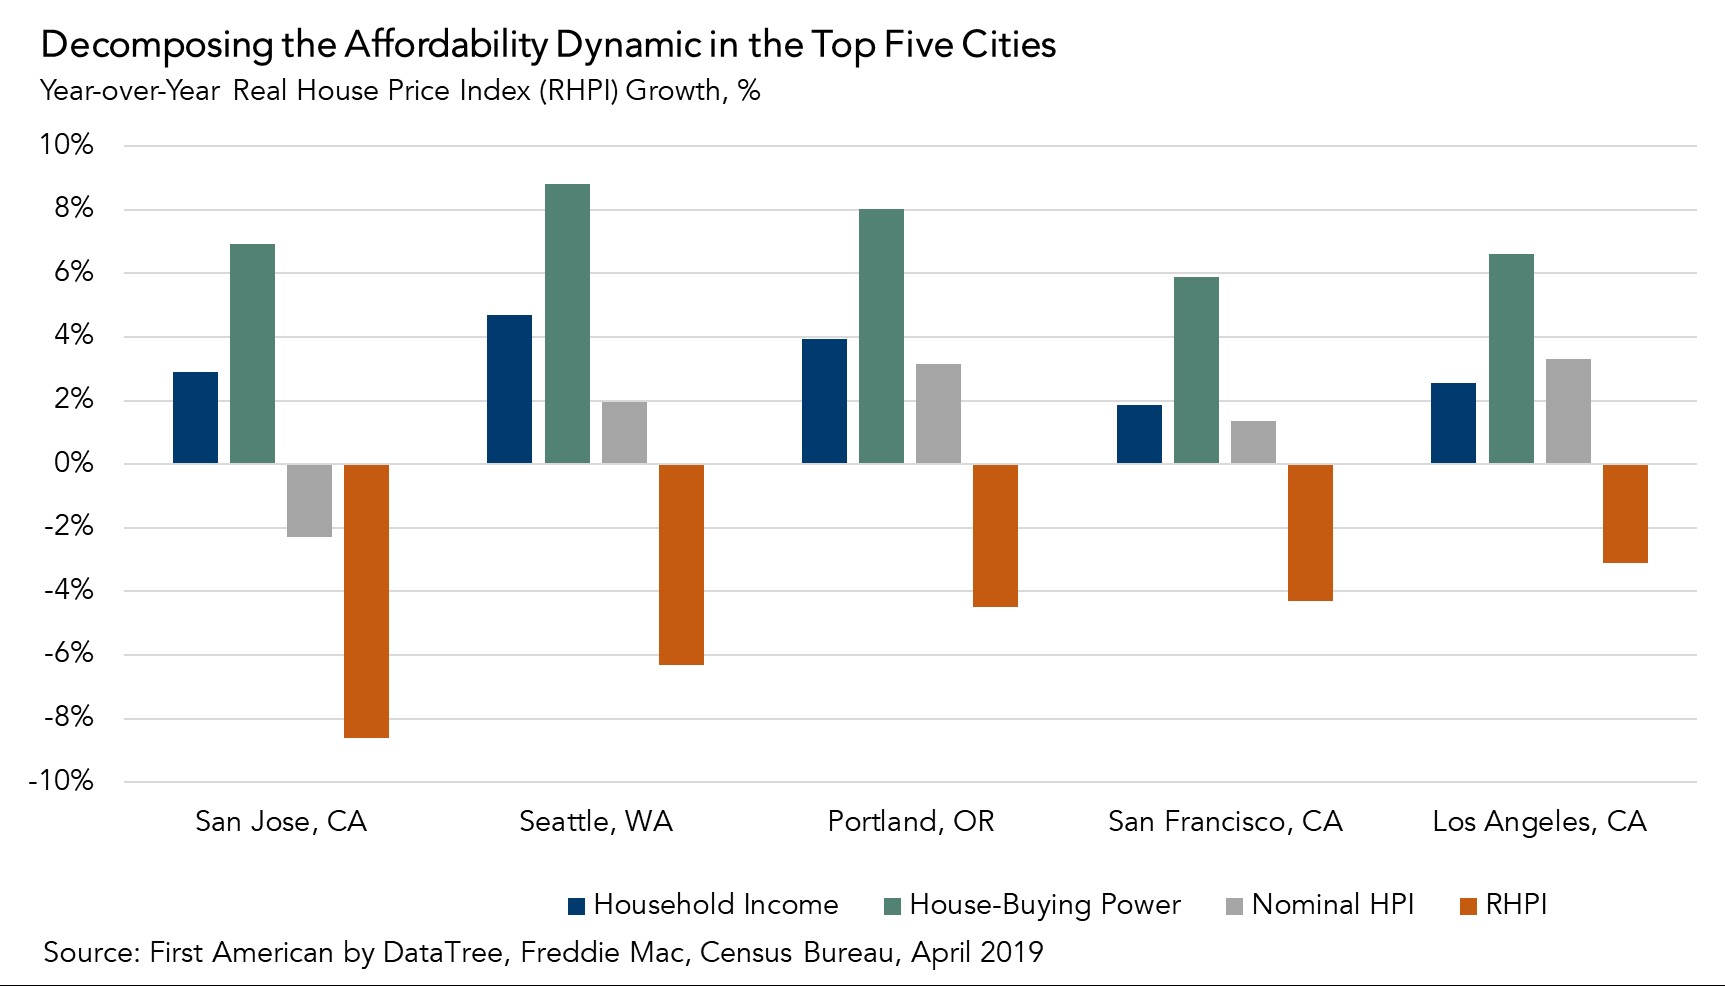
San Jose saw the greatest increase in affordability as house-buying power jumped by 6.9 percent due to the decline in mortgage rates and a 2.9 percent increase in household income compared with a year ago. Nominal house prices in San Jose also declined by 2.3 percent year-over-year, which further contributed to the 8.6 percent decline in real house prices. In Seattle, house-buying power increased by 8.8 percent due to a 4.7 percent increase in household income, which was more than enough to counter the 2 percent increase in nominal house prices compared with a year ago.
The intricate dance between house-buying power and nominal house price appreciation determines the direction and pace of affordability trends. Faster nominal house price appreciation could erode or even eliminate the affordability boosting benefits of lower mortgage rates and rising income. In April, home buyers were grateful that faster nominal house price appreciation was not enough to overpower the increase in house-buying power. Yet, more house-buying power brings more demand and possibly even faster house price appreciation. The dance continues.
For the full analysis of affordability, please visit the Real House Price Index. The RHPI is updated monthly with new data. Look for the next edition of the RHPI the week of July 29, 2019.
Sources:
April 2019 Real House Price Index Highlights
The First American Real House Price Index (RHPI) showed that in April 2019:
- Real house prices decreased 0.9 percent between March 2019 and April 2019.
- Real house prices declined 0.72 percent between April 2018 and April 2019.
- Consumer house-buying power, how much one can buy based on changes in income and interest rates, increased 1.5 percent between March 2019 and April 2019, and increased 6.7 percent year over year.
- Average household income has increased 2.7 percent since April 2018 and 56.2 percent since January 2000.
- Real house prices are 15.0 percent less expensive than in January 2000.
- While unadjusted house prices are now 2.8 percent above the housing boom peak in 2006, real, house-buying power-adjusted house prices remain 40.7 percent below their 2006 housing boom peak.
April Real House Price State Highlights
- The five states with the greatest year-over-year increase in the RHPI are: Wisconsin (+4.7 percent), Rhode Island (+4.3 percent), New Hampshire (+3.5 percent), Georgia (+2.8 percent), and Ohio (+2.4 percent).
- The five states with the greatest year-over-year decrease in the RHPI are: North Dakota (-7.4 percent), Wyoming (-6.6 percent), Louisiana (-4.3 percent), Vermont (-3.9 percent), and Oklahoma (-3.6 percent).
April 2019 Real House Price Local Market Highlights
- Among the Core Based Statistical Areas (CBSAs) tracked by First American, the five markets with the greatest year-over-year increase in the RHPI are: Providence, R.I. (+5.9 percent), Las Vegas (+5.2 percent), Salt Lake City (+4.4 percent), Orlando, Fla. (+3.9 percent), and Atlanta (+3.7 percent).
- Among the Core Based Statistical Areas (CBSAs) tracked by First American, the five markets with the greatest year-over-year decrease in the RHPI are: San Jose, Calif. (-8.6 percent), Seattle (-6.3 percent), Portland, Ore. (-4.5 percent), San Francisco (-4.3 percent), and Los Angeles (-3.1 percent).
About the First American Real House Price Index
The traditional perspective on house prices is fixated on the actual prices and the changes in those prices, which overlooks what matters to potential buyers - their purchasing power, or how much they can afford to buy. First American’s proprietary Real House Price Index (RHPI) adjusts prices for purchasing power by considering how income levels and interest rates influence the amount one can borrow.
The RHPI uses a weighted repeat-sales house price index that measures the price movements of single-family residential properties by time and across geographies, adjusted for the influence of income and interest rate changes on consumer house-buying power. The index is set to equal 100 in January 2000. Changing incomes and interest rates either increase or decrease consumer house-buying power. When incomes rise and mortgage rates fall, consumer house-buying power increases, acting as a deflator of increases in the house price level. For example, if the house price index increases by three percent, but the combination of rising incomes and falling mortgage rates increase consumer buying power over the same period by two percent, then the Real House Price index only increases by 1 percent. The Real House Price Index reflects changes in house prices, but also accounts for changes in consumer house-buying power.


