First American's proprietary Potential Home Sales model examines December 2016 data and includes analysis from Chief Economist Mark Fleming on the impact of rising rates amid growing demand and limited inventory.
"The market potential for existing-home sales declined due to the rise in mortgage rates, offsetting increased demand generated by broader economic strength."
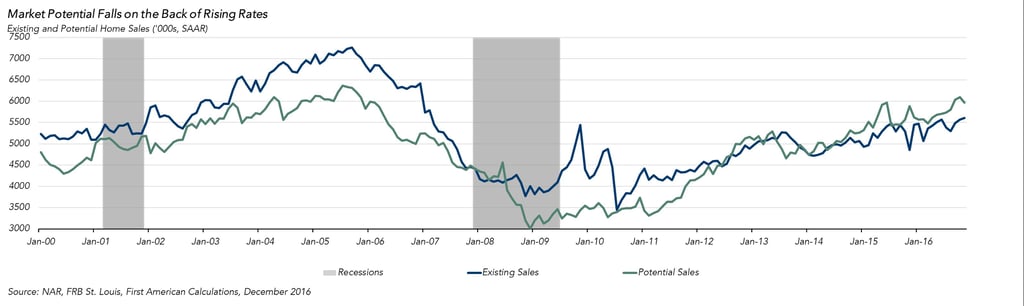
December 2016 Potential Home Sales
For the month of December, First American updated its proprietary Potential Home Sales model to show that:
- Potential existing-home sales decreased to a 5.8 million seasonally adjusted, annualized rate (SAAR).
- This represents a 92.5 percent increase from the market potential low point reached in December 2008.
- In December, the market potential for existing-home sales grew by 2.9 percent compared with a year ago, an increase of 164,000 (SAAR) sales.
- Currently, potential existing-home sales is 432,000 (SAAR) or 7.5 percent below the pre-recession peak of market potential, which occurred in July 2005.
Market Performance Gap
- The market for existing-home sales is underperforming its potential by 2.2 percent or an estimated 129,000 (SAAR) of sales.
- Last month’s revised underperformance gap was -6.2 percent or 370,000 (SAAR) sales.
Rising Mortgage Rates Lower Market Potential, But Constrained Supply is Driving Price Appreciation
“The market potential for existing-home sales fell 3.1 percent between November and December due to the post-election rate increase, offsetting increased demand caused by the strength of the broader economy, particularly wage growth and improving access to credit. However, the market continues to underperform its potential due to the highly limited inventory,” said Mark Fleming, chief economist at First American. “While low inventories are still responsible for higher prices, I expect the impact of the increasing mortgage rates will cause a modest cooling in house price growth in 2017.”
Chief Economist Analysis Highlights
- According to the National Association of Realtors, existing-home sales grew 0.7 percent between October and November to 5.6 million (SAAR). The increase was driven mainly by an increase in sales activity in the Northeast, which grew by 8.0 percent over the course of the month.
- As I highlighted last month, the post-election increase in mortgage rates is contributing to the slower growth in sales activity. However, the most significant influence on sales is the lack of homes listed for sale, particularly entry-level homes. The supply of homes for sale has declined for 18 consecutive months, falling to 4.0 months in November – a level not seen since the mid-2000s.
- Home price appreciation is typically more sensitive to mortgage rate increases. Rising rates may slow the house price growth rate by as much as 2 percent by the end of 2017.
- The low inventory of homes for sale continues to be a concern, as it is putting upward pressure on house prices and could counteract the downward price pressure caused by higher mortgage rates.
- One thing to watch for in 2017 is evidence of a “lockout effect,” where homeowners are hesitant to sell their home if their mortgage rate is lower than the current market rate.
- Even though rising rates reduce affordability for potential first-time homebuyers, the expected moderation of price appreciation will align house price growth more closely with recently increasing income growth to help offset reduced affordability.
What Insight Does the Potential Home Sales Model Reveal?
When considering the right time to buy or sell a home, an important factor in the decision should be the market’s overall health, which is largely a function of supply and demand. Knowing how close the market is to a healthy level of activity can help consumers determine if it is a good time to buy or sell, and what might happen to the market in the future. That’s difficult to assess when looking at the number of homes sold at a particular point in time without understanding the health of the market at that time. Historical context is critically important. Our potential home sales model measures what we believe a healthy market level of home sales should be based on the economic, demographic, and housing market environments.
About the Potential Home Sales Model
Potential home sales measures existing-homes sales, which include single-family homes, townhomes, condominiums and co-ops on a seasonally adjusted annualized rate based on the historical relationship between existing-home sales and U.S. population demographic data, income and labor market conditions in the U.S. economy, price trends in the U.S. housing market, and conditions in the financial market. When the actual level of existing-home sales are significantly above potential home sales the pace of turnover is not supported by market fundamentals and there is an increased likelihood of a market correction. Conversely, seasonally adjusted, annualized rates of actual existing-home sales below the level of potential existing-home sales indicate market turnover is underperforming the rate fundamentally supported by the current conditions. Actual seasonally adjusted, annualized existing-home sales may exceed or fall short of the potential rate of sales for a variety of reasons, including non-traditional market conditions, policy constraints and market participant behavior. Recent potential home sale estimates are subject to revision in order to reflect the most up-to-date information available on the economy, housing market and financial conditions. The Potential Home Sales model is published prior to the National Association of Realtors’ Existing-Home Sales report each month.


