In 2022, National Homeownership Month arrived in June as the housing market adjusts to higher mortgage rates amid still strong nominal house price appreciation, which have resulted in a significant decline in house-buying power. The housing boom of 2020 and 2021 was the exception, not the rule. Record-low mortgage rates, the ability to work from home, and a pandemic-driven desire for more space accelerated demand for homeownership in 2020. In 2021, homeownership demand fell compared with the previous year, but remained significantly higher compared with pre-pandemic levels in 2019. Yet, the underlying demographic and lifestyle choices that are important drivers for homeownership demand remained strong in 2021.
"While 2020 and 2021 were characterized by pandemic-era forces, such as the desire for more space and record-low mortgage rates, declining affordability may temper millennial homeownership demand in 2022."
The homeownership rate is influenced by underlying demographic and economic factors, as well as housing market conditions. Close examination of these underlying forces can provide a more in-depth understanding of the changes in the homeownership rate over time. Our annual Homeownership Progress Index (HPRI) accounts for the influence of critical lifestyle, societal and economic trends on the likelihood of owning a home, providing a measure of potential homeownership demand.
Homeownership Rate Continues to Underperform Potential
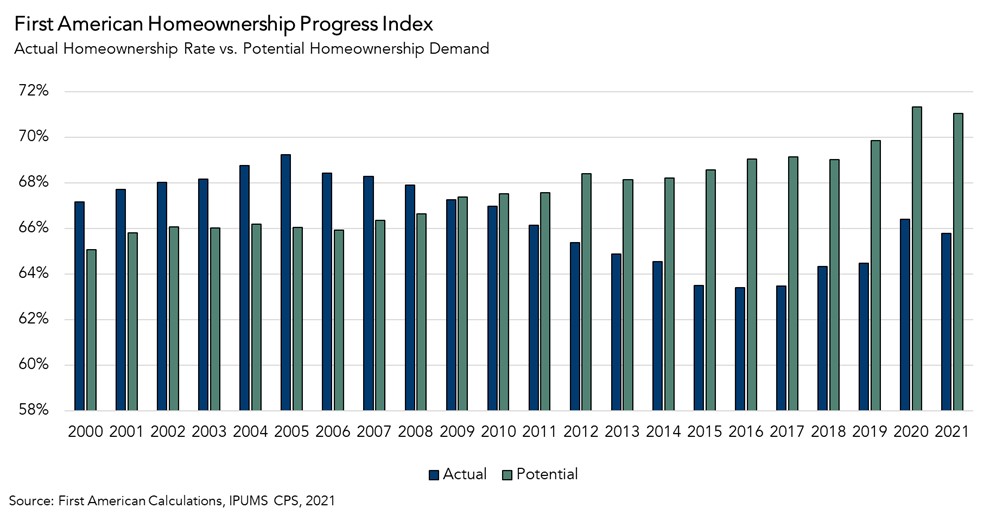
A historical comparison of the homeownership rate with potential homeownership demand according to the HPRI reveals that from 2000 through 2008 the actual homeownership rate exceeded potential homeownership demand by an average of 2.2 percentage points. When the actual homeownership rate exceeds the HPRI, it indicates that the homeownership rate is above the levels supported by demographic and economic fundamentals and may be elevated by other market dynamics. This was indeed the case at the peak of the gap in 2005, when speculation and easy access to credit caused the actual homeownership rate to exceed potential homeownership demand by 3.2 percentage points.
However, since 2009, potential homeownership demand, based on the lifestyle, societal and economic factors tracked in our HPRI model, has exceeded the actual homeownership rate. When the HPRI exceeds the actual homeownership rate, it indicates that homeownership may be restricted by market forces, such as a historically low supply of homes for sale.
In 2021, rising house-buying power, driven primarily by low mortgage rates, was a primary driver of potential demand. Between 2011 and 2021, the annual average of the 30-year, fixed mortgage rate remained near or below 4.5 percent, significantly below the pre-2011 average of 8.9 percent. In 2021, mortgage rates fell to 2.96 percent, their lowest annual average level in history, boosting house-buying power and further elevating potential homeownership demand, which exceeded the actual homeownership rate by 5.3 percentage points.
Millennials Continue to Drive Potential Homeownership Demand
Millennials are the largest generation in U.S. history, and the majority turned 31 in 2021. Historically, millennials have delayed the critical lifestyle choices often linked to buying a first home, including getting married and having children, in order to further their education. This is clear in cross-generational comparisons of homeownership rates, which show millennials lagging their generational predecessors. At age 30, 42 percent of millennials owned homes, compared with 48 percent of Gen Xers at the same age. Yet, millennials have significantly narrowed this gap as they move into a new phase of their lives. At the same age of 40, the millennial homeownership rate is 60.3 percent, while Gen X stood at 63.5 percent.
In 2021, potential homeownership demand improved by 1.4 percentage points for millennials, the largest increase among their generational predecessors. Higher educational attainment, an increase in the number of children per household, higher marital rates, and greater house-buying power were all drivers of higher homeownership demand in 2021 compared with 2020. While millennial homeownership has been delayed relative to their generational predecessors, millennials continue to have a strong influence on potential homeownership demand as they continue to age into their early-to-mid thirties and make the lifestyle decisions that are highly correlated with buying a home.
While millennial homeownership demand grew in 2021, faster nominal house price appreciation alongside rapidly rising mortgage rates have dampened affordability and made it difficult for first-time home buyers to enter the market. While 2020 and 2021 were characterized by pandemic-era forces, such as the desire for more space and record-low mortgage rates, declining affordability may temper millennial homeownership demand in 2022. Nevertheless, the lifestyle choices that highly correlate with homeownership will persist. Buying a home is both a financial and lifestyle decision, and despite growing affordability headwinds, millennials continue to transition to their prime home-buying age and will remain the driving force in potential homeownership demand in the years ahead.
2021 HOMEOWNERSHIP PROGRESS INDEX
The First American Homeownership Progress Index (HPRI) showed that in 2021:
- Nationally, potential homeownership demand represented by the HPRI decreased 0.3 percentage points in 2021 compared with 2020, based on changes in the underlying lifestyle, societal and economic data.
- Some factors that increased potential homeownership demand included house-buying power growth[1] (+0.05 percent), an aging population (+0.018 percent), rising educational attainment (+0.05 percent), and the increase in the number of children per household (0.0009 percent).
- The increase in the U-6 unemployment rate [2]decreased potential homeownership demand (-0.14).
- Potential homeownership demand increased from 2020 to 2021 in 23 of the 50 metropolitan areas tracked by First American, as demographic and economic trends in these cities raised the likelihood of homeownership.
2021 Homeownership Progress Index State Highlights
- The five states with the greatest year-over-year increase in potential homeownership demand are: Indiana (+1.7 percentage points), Virginia (+1.0 percentage points), Tennessee (+0.8 percentage points), North Carolina (+0.5 percentage points), and New York (+0.4 percentage points).
- The five states year-over-year decrease in potential homeownership demand are: Alaska (-3.3 percentage points), Delaware (-3.0 percentage points), Nevada (-2.6 percentage points), Washington (-2.3 percentage points), and Nebraska (-1.9 percentage points).
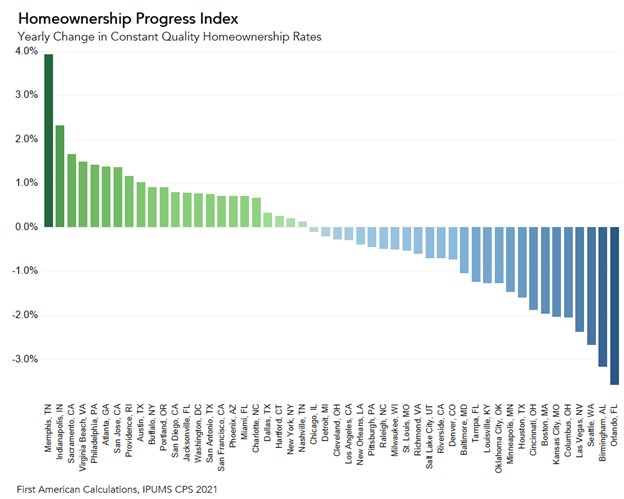
2021 Homeownership Progress Index Local Market Highlights
- Among the largest 50 Core Based Statistical Areas (CBSAs), the five markets with the greatest year-over-year increase in potential homeownership demand are: Memphis, Tenn. (+3.9 percentage points), Indianapolis (+2.3 percentage points), Sacramento, Calif. (+1.7 percentage points), Virginia Beach, Va. (+1.5 percentage points), Philadelphia (+1.4 percentage points).
- Among the largest 50 CBSAs, the markets with the greatest year-over-year decrease in potential homeownership demand are: Orlando, Fla. (-3.6 percentage points), Birmingham, Ala. (-3.2 percentage points), Seattle (-2.7 percentage points), Las Vegas (-2.4 percentage points), and Columbus, Ohio (-2.1 percentage points).
[1] The 2021 house-buying power uses March 2021 ASEC household income results, which reports the total money income during the previous calendar year of all adult household members.
[2] The 2020 and 2021 HPRI will not capture the full effect of the COVID crisis and subsequent rebound as the ASEC survey was conducted in March 2020 and again in March 2021.
About the First American Homeownership Progress Index
The First American Homeownership Progress Index is an economic model that uses annual IPUMS CPS individual anonymized census survey data to measure the influence of household circumstances and demographic, societal and economic characteristics on one’s choice to own a home. Demographic characteristics include age, race/ethnicity, gender, marital status and number of children. Additionally, the model includes educational attainment, income, the 30-year fixed rate mortgage rate and the unemployment rate to help explain changes in homeownership rates. The individual factors influencing homeownership can be isolated, while all other factors are held equal, to provide a unique perspective on the impact the isolated factor has on the likelihood of homeownership.
The HPRI can provide the likelihood of homeownership for a given demographic and economic profile. For example, an educated man with two children and a higher income will have a higher likelihood of homeownership than a single man without a higher education degree.


