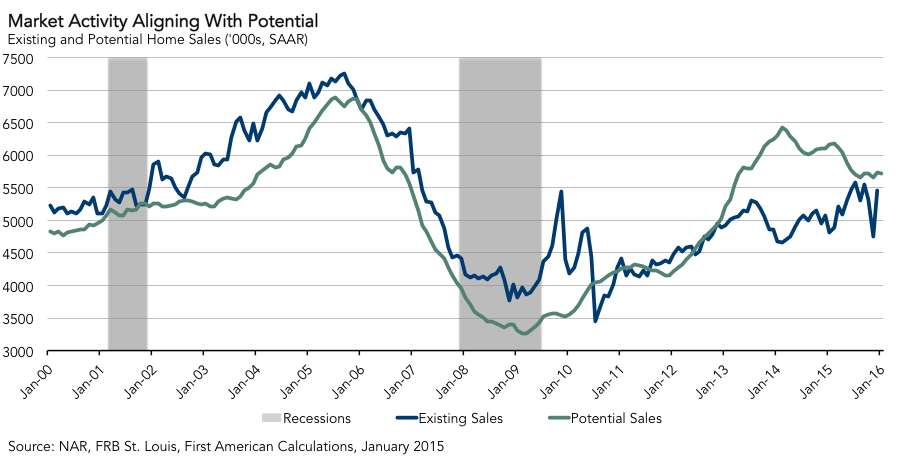
For the month of January, First American’s proprietary Potential Home Sales model showed that the market potential for existing-home sales declined by 0.2 percent compared to December and decreased by 7.1 percent compared to a year ago. The Potential Home Sales model provides a gauge on whether existing-home sales are under or over their long-run potential level based on current market fundamentals.
"The rebound in December existing-home sales is much more in line with our expectations for market sale activity," says Chief Economist Mark Fleming
According to the model, the seasonally adjusted, annualized rate (SAAR) of potential existing-home sales is up 76 percent from the low point reached in February 2009*. The rate of potential home sales in the model decreased by 12,000 (SAAR) in January. The potential home sales rate is down 702,000 (SAAR) from the most recent peak in February 2014.
The model’s current underperformance gap is an estimated 168,000 (SAAR), which is significantly less than the sales potential gap of 1.8 million existing-home sales in February 2014.
Analysis: Market Rebounds to Potential
The significant drop in existing-home sales to 4.76 million (SAAR) in November was largely reversed in December with a reported level of 5.46 million existing-home sales in December. As we discussed in last month’s release of our Potential Home Sales model, the October to November swoon was not unique to 2015. At the time, Pending Homes Sales indicated that there would be a strong rebound in December, as delayed closings due to the Know-Before-You-Owe rule eventually closed. Last month, we argued that the month-over-month volatility was not an indication of any fundamental changes in market conditions. The rebound in December existing-home sales is much more in line with our expectations for market sale activity.
This month, potential home sales remained at the 5.7 million (SAAR) level, reducing the gap between our forecasted January actual existing-home sales level and potential existing-home sales in January to a meager 168,000 sales. The market is aligning with its potential.

Mortgage rates actually declined in January due to the high degree of market volatility and the ‘flight to safety’ that drove down long-term treasury yields, the benchmark underpinning long-term mortgage rates. Originally suggesting that 2016 would be the year in which rates begin normalization, the Fed is now much more likely to slow down the pace of rate normalization due to deterioration in global economic conditions. Is it possible that mortgage rates could break through to new historic lows or remain below 4 percent for another year? As usual, mortgage rate trends will heavily influence housing prices.
House price appreciation cooled modestly late last year, but could strengthen again based on the leverage assistance that low rates provide to consumers’ purchasing power. All else equal, lower rates mean borrowers can bid more for housing. In a market of limited supply, leverage-assisted demand drives prices higher. Actual price appreciation is currently stronger than what is fundamentally supported by market conditions. This leverage-assisted housing inflation could persist if rates remain low. Even though modest increases in mortgage rates this year would not have a dramatic impact on home sales, the likelihood of modest mortgage rate increases seems less likely now.
With the initial delay in closings triggered by Know-Before-You-Owe seemingly behind us, and global economic uncertainty driving down mortgage rates, 2016 remains a year to be bullish on housing. First-time homebuyers will be able to benefit from strong purchasing power in a low-rate environment. This year, the housing market may indeed achieve its potential.
Next Potential Home Sales release: March 16, 2016 for February data
*Previous Potential Home Sales releases referred to November 2011 as the low point of sales. The model used to generate existing-home sales potential has been enhanced to more accurately reflect the dynamic relationships between sales, prices, interest rates and the user-cost of housing, resulting in a model that more accurately reflects past conditions.
About the Potential Home Sales Model
First American’s proprietary Potential Home Sales model provides a gauge on whether existing-homes sales are under or over long-run potential based on current market circumstances. The model’s potential home sales seasonally adjusted annualized rate provides a measure on whether existing-homes sales, which include single-family homes, townhomes, condominiums and co-ops, are outperforming or underperforming based on current market fundamentals. The Potential Home Sales model estimates the historical relationship between existing-home sales and U.S. population demographic data, income and labor market conditions in the U.S. economy, price trends in the U.S. housing market, and conditions in the financial market. For example, seasonally adjusted, annualized rates of actual existing-home sales above the level of potential home sales indicate market turnover is outperforming the rate fundamentally supported by the current conditions. Conversely, seasonally adjusted, annualized rates of actual existing-home sales below the level of potential existing-home sales indicate market turnover is underperforming the rate fundamentally supported by the current conditions. Actual seasonally adjusted, annualized existing-home sales may exceed or fall short of the potential rate of sales for a variety of reasons, including non-traditional market conditions, policy constraints and market participant behavior. Recent potential home sale estimates are subject to revision in order to reflect the most up-to-date information available on the economy, housing market and financial conditions. The Potential Home Sales model will be published prior to the National Association of Realtors’ Existing-Home Sales report each month.
Click to edit your new post...


