In the first report with 2022 data, the Real House Price Index (RHPI) jumped up by nearly 27 percent, the fastest growth in the RHPI since 2004. This rapid annual decline in affordability was driven by a 21.7 percent annual increase in nominal house prices and a 0.7 percentage point increase in the 30-year, fixed mortgage rate compared with one year ago. Even though household income increased 5 percent since January 2021, it was not enough to offset the negative impact on consumer house-buying power from higher rates and fast rising nominal prices.
“Homes are less affordable than they were a year ago, but nationally and in most markets they remain much more affordable than at the peak of the 2006 housing boom.”
In the near term, affordability is likely to wane further nationally as rising mortgage rates and increasing house prices continue to outpace gains in household income. However, it’s helpful to put affordability in historical context.
Homes More Affordable Today Than 2006 Housing Peak
Nationally, real, house-buying power-adjusted house prices remain 29 percent below the peak in April 2006. While consumer house-buying power declined in January 2022, it remains near record levels and more than double the level of consumer house-buying power in April 2006 thanks to higher household income and significantly lower mortgage rates. Household incomes today are nearly 48 percent greater than April 2006 and the average mortgage rate is over 3 percentage points below its April 2006 level. In fact, real house prices nationally are at the same level they were in 2000. But real estate is local, and the recovery from the housing boom and crash varies by market, so where has affordability improved the most compared with the prior peak?

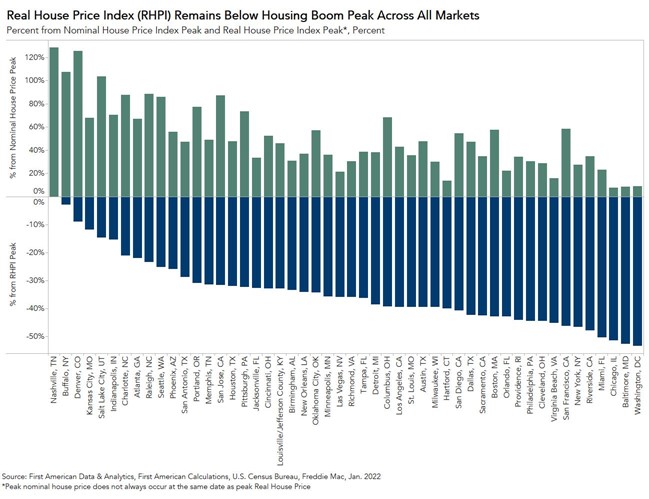
All 50 Markets in the RHPI are More Affordable than Previous Housing Boom Peak
For nominal house prices, all 50 markets we track in the RHPI have surpassed their previous housing price peaks. Yet, nominal house prices don’t tell the whole affordability story. While nominal house prices have increased, house-buying power has also increased because of a long-run decline in mortgage rates and the slow, but steady growth of household income. House-buying power matters because people buy homes based on how much it costs each month to make a mortgage payment, not the price of the home. Mortgage rates are generally the same across the country, so the long-run decline in mortgage rates boosts affordability equally in each market. Household income growth and nominal house prices, on the other hand, differ from market to market, so affordability varies geographically as well.
According to our house-buying power-adjusted RHPI, homes are 34 percent more affordable on average across all 50 markets than their respective RHPI peaks. While the supply-demand imbalance in today’s housing market continues to fuel strong house price appreciation across the country, the dramatic increase in house-buying power relative to 2006 driven by lower mortgage rates and higher incomes has more than made up for it. In fact, in four cities homes are more than 50 percent more affordable today than at their prior RHPI peak.
Top 5 Cities Where Affordability Has Improved the Most Since Their Prior Peak
- Washington D.C. (53 percent from peak)
- Baltimore (53 percent from peak)
- Chicago (52 percent from peak)
- Miami (50 percent from peak)
- Riverside, Calif. (48 percent from peak)
Top 5 Cities Where Affordability Has Improved the Least Since Their Prior Peak
- Nashville, Tenn. (0.3 percent from peak)
- Buffalo, N.Y. (3 percent from peak)
- Denver (9 percent from peak)
- Kansas City, Mo. (12 percent from peak)
- Salt Lake City (15 percent from peak)
Homes are less affordable than they were a year ago, but nationally and in most markets they remain much more affordable than at the peak of the 2006 housing boom. House prices are widely expected to continue to increase, although at a slower pace, and mortgage rates are likely to rise, so it’s likely that affordability will decline further, but in most markets we’re still a long way from the mid-2000s boom.
For more analysis of affordability, please visit the Real House Price Index. The RHPI is updated monthly with new data. Look for the next edition of the RHPI the week of April 18, 2022.
Sources:
January 2022 Real House Price Index Highlights
The First American Real House Price Index (RHPI) showed that in January 2022:
- Real house prices increased 6.3 percent between December 2021 and January 2022.
- Real house prices increased 26.8 percent between January 2021 and January 2022.
- Consumer house-buying power, how much one can buy based on changes in income and interest rates, decreased 4.0 percent between December 2021 and January 2022, and decreased 4.0 percent year over year.
- Median household income has increased 5.0 percent since January 2021 and 69.9 percent since January 2000.
- Real house prices are 0.5 percent more expensive than in January 2000.
- While unadjusted house prices are now 46.6 percent above the housing boom peak in 2006, real, house-buying power-adjusted house prices remain 29.5 percent below their 2006 housing boom peak.
January 2022 Real House Price State Highlights
- The five states with the greatest year-over-year increase in the RHPI are: Arizona (+38.3 percent), Florida (+37.4), South Carolina (+35.6 percent), Georgia (+34.2), and Connecticut (+33.5 percent).
- There were no states with a year-over-year decrease in the RHPI.
January 2022 Real House Price Local Market Highlights
- Among the Core Based Statistical Areas (CBSAs) tracked by First American, the five markets with the greatest year-over-year increase in the RHPI are: Charlotte, N.C. (+40.9), Phoenix (+40.4 percent), Raleigh, N.C. (+36.9 percent), Atlanta (+36.7 percent), and Jacksonville, Fla. (+36.5 percent).
- Among the Core Based Statistical Areas (CBSAs) tracked by First American, there were no markets with a year-over-year decrease in the RHPI.
About the First American Real House Price Index
The traditional perspective on house prices is fixated on the actual prices and the changes in those prices, which overlooks what matters to potential buyers - their purchasing power, or how much they can afford to buy. First American’s proprietary Real House Price Index (RHPI) adjusts prices for purchasing power by considering how income levels and interest rates influence the amount one can borrow.
The RHPI uses a weighted repeat-sales house price index that measures the price movements of single-family residential properties by time and across geographies, adjusted for the influence of income and interest rate changes on consumer house-buying power. The index is set to equal 100 in January 2000. Changing incomes and interest rates either increase or decrease consumer house-buying power. When incomes rise and mortgage rates fall, consumer house-buying power increases, acting as a deflator of increases in the house price level. For example, if the house price index increases by three percent, but the combination of rising incomes and falling mortgage rates increase consumer buying power over the same period by two percent, then the Real House Price index only increases by 1 percent. The Real House Price Index reflects changes in house prices, but also accounts for changes in consumer house-buying power.
Disclaimer
Opinions, estimates, forecasts and other views contained in this page are those of First American’s Chief Economist, do not necessarily represent the views of First American or its management, should not be construed as indicating First American’s business prospects or expected results, and are subject to change without notice. Although the First American Economics team attempts to provide reliable, useful information, it does not guarantee that the information is accurate, current or suitable for any particular purpose. © 2022 by First American. Information from this page may be used with proper attribution.


