In August, year-over-year nominal house price appreciation reached 20.7 percent, the third consecutive month it has set a new record. According to our Real House Price Index (RHPI), which measures housing affordability in the context of changes in consumer house-buying power, incorporating changes in household income, mortgage rates and nominal house prices, affordability declined 16.6 percent. The growth in nominal house prices vastly outpaced the 3.5 percent increase in house-buying power compared with a year ago, yet real, house-buying power-adjusted house prices remain 37.5 percent below their 2006 housing boom peak.
“Rising rates will lower affordability, but rising household incomes can help to mitigate the impact.”
Is This the End of Housing’s 40-Year Tailwind?
The overall downward trend in the average 30-year, fixed mortgage rate has been one of the most important driving forces of both purchase and refinance activity for the last 40 years. Holding income constant, lower mortgage rates allow a borrower to borrow the same amount for less. As mortgage rates have drifted lower over the last several decades, borrowers have seen their purchasing power increase, which has facilitated move-up buying, higher housing market turnover (more sales as a percentage of the housing stock) and increased refinancing activity. Average mortgage rates won’t stay as low as they are today forever, and as they rise, the decades-long housing and mortgage market tailwind will turn into a headwind. Rising mortgage rates, all else equal, will diminish house-buying power, meaning it will cost more per month for a borrower to buy “their same home.”
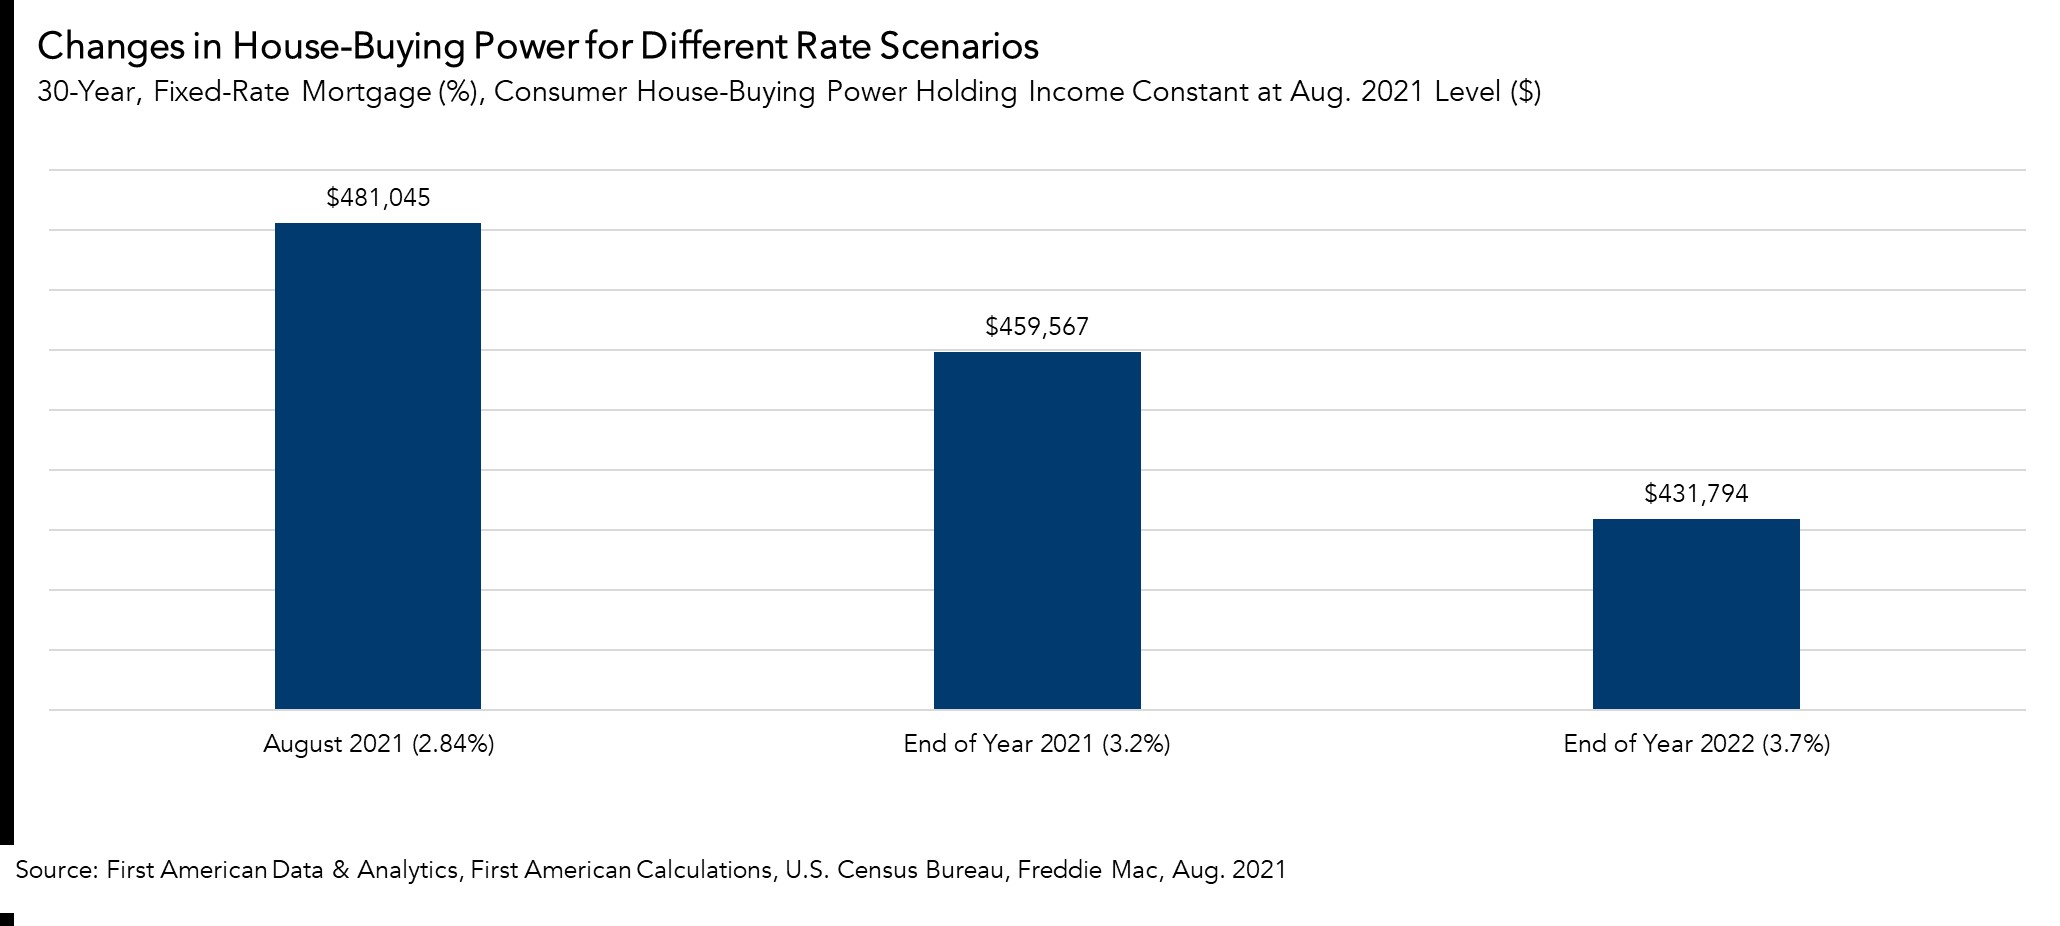
Multiple factors point to modestly higher mortgage rates in the months to come, including continued inflation, an ongoing economic recovery, and the possibility of the Fed beginning to taper its purchase of mortgage-backed securities. The popular 30-year, fixed mortgage rate is loosely benchmarked to the 10-year Treasury bond. When global investors sense increased uncertainty, there is a “flight to safety” in U.S. Treasury bonds, which causes their price to go up, and their yield to go down. The opposite is true when the economy is improving, as it is now and as it is widely expected to continue in the months ahead. Consensus forecasts predict that mortgage rates will hit 3.2 percent by the end of the year, and 3.7 percent by the end of 2022. So, let’s examine how these mortgage rate scenarios would impact house-buying power.
Rates Above 3.5 Percent Likely in 2022
We can use the RHPI to model shifts in income and interest rates and see how they either increase or decrease consumer house-buying power or affordability. When incomes rise and/or mortgage rates fall, consumer house-buying power increases.
If the average mortgage rate increased from its August level of 2.84 percent to the expected end-of-year level of 3.2 percent, assuming a 5 percent down payment, and the August 2021 average household income of $68,658, house-buying power falls by approximately $21,500. If rates increased to the anticipated end of 2022 level, 3.7, percent, house-buying power would fall by $49,000.
Higher Income to the Rescue?
Rising mortgage rates impact affordability, but one of the root causes of rising mortgage rates is an improving economy, and an improving economy often leads to higher wage growth. In fact, our estimate of average household income increased approximately 0.2 percent on a monthly basis in August 2021. If incomes continue to increase at a rate of 0.2 percent per month through the end of 2021, the higher income will reduce the projected end-of-year 2021 decrease in house-buying power from $22,000 to nearly $18,000. And if incomes continued to grow at 0.2 percent through the end of 2022, the projected end-of-year 2022 decrease in house-buying power would drop from $49,000 to $35,000.
Rising household income limits the negative impact that higher rates will have on house-buying power. Rising rates will lower affordability, but rising household incomes can help to mitigate the impact. Ultimately, changes in affordability depend on the tug-of-war between rising household income and upward pressure on mortgage rates.
For more analysis of affordability, please visit the Real House Price Index. The RHPI is updated monthly with new data. Look for the next edition of the RHPI the week of November 29, 2021.
Sources:
August 2021 Real House Price Index Highlights
The First American Real House Price Index (RHPI) showed that in August 2021:
- Real house prices increased 1.2 percent between July 2021 and August 2021.
- Real house prices increased 16.6 percent between August 2020 and August 2021.
- Consumer house-buying power, how much one can buy based on changes in income and interest rates, increased 0.5 percent between July 2021 and August 2021, and increased 3.5 percent year over year.
- Median household income has increased 2.3 percent since August 2020 and 65.2 percent since January 2000.
- Real house prices are 10.9 percent less expensive than in January 2000.
- While unadjusted house prices are now 36.4 percent above the housing boom peak in 2006, real, house-buying power-adjusted house prices remain 37.5 percent below their 2006 housing boom peak.
August 2021 Real House Price State Highlights
- The five states with the greatest year-over-year increase in the RHPI are: Arizona (+27.8 percent), Nevada (+20.6 percent), Florida (+20.5), Connecticut (+20.1), and Vermont (+19.8 percent).
- There were no states with a year-over-year decrease in the RHPI.
August 2021 Real House Price Local Market Highlights
- Among the Core Based Statistical Areas (CBSAs) tracked by First American, the five markets with the greatest year-over-year increase in the RHPI are: Phoenix (+29.7 percent), Jacksonville, Fla. (+25.1 percent), Tampa, Fla. (+24.9 percent), Charlotte, N.C. (+24.1), and Las Vegas (+21.4 percent).
- Among the Core Based Statistical Areas (CBSAs) tracked by First American, there were no markets with a year-over-year decrease in the RHPI.
About the First American Real House Price Index
The traditional perspective on house prices is fixated on the actual prices and the changes in those prices, which overlooks what matters to potential buyers - their purchasing power, or how much they can afford to buy. First American’s proprietary Real House Price Index (RHPI) adjusts prices for purchasing power by considering how income levels and interest rates influence the amount one can borrow.
The RHPI uses a weighted repeat-sales house price index that measures the price movements of single-family residential properties by time and across geographies, adjusted for the influence of income and interest rate changes on consumer house-buying power. The index is set to equal 100 in January 2000. Changing incomes and interest rates either increase or decrease consumer house-buying power. When incomes rise and mortgage rates fall, consumer house-buying power increases, acting as a deflator of increases in the house price level. For example, if the house price index increases by three percent, but the combination of rising incomes and falling mortgage rates increase consumer buying power over the same period by two percent, then the Real House Price index only increases by 1 percent. The Real House Price Index reflects changes in house prices, but also accounts for changes in consumer house-buying power.
Disclaimer
Opinions, estimates, forecasts and other views contained in this page are those of First American’s Chief Economist, do not necessarily represent the views of First American or its management, should not be construed as indicating First American’s business prospects or expected results, and are subject to change without notice. Although the First American Economics team attempts to provide reliable, useful information, it does not guarantee that the information is accurate, current or suitable for any particular purpose. © 2021 by First American. Information from this page may be used with proper attribution.


