In January 2024, mortgage rates declined and affordability improved by nearly 2 percent compared with December, according to the Real House Price Index (RHPI). However, on an annualized basis, affordability decreased by approximately 7 percent. Two factors drove the sharp annualized drop in affordability – a 7.1 percent annual increase in nominal house prices, according to our First American Data & Analytics House Price Index, and a 0.4 percentage point increase in the 30-year, fixed mortgage rate compared with one year ago.
For home buyers, holding prices constant, the only way to mitigate the loss of affordability caused by higher mortgage rates is with an equivalent, if not greater, increase in household income. Even though household income increased 3.9 percent since January 2023 and boosted consumer house-buying power, it was not enough to offset the affordability loss from higher mortgage rates and rising nominal prices.
“Even modest improvements in housing affordability will be welcome news for buyers currently sitting on the sidelines.”
The Housing Implications of “Higher for Longer”
At the end of 2023, the market was expecting that the Fed would cut rates six-to-seven times in 2024. However, with the economy and labor market proving resilient, and inflation remaining stickier than anticipated, the Fed seeks further assurance that inflation is headed sustainably towards their 2 percent target. As a result, expectations for rate cuts have pivoted, and the majority expect three or fewer rate cuts this year.
While the 30-year, fixed mortgage rate isn’t directly tied to Fed actions, it is loosely benchmarked to the 10-year Treasury yield. Many factors can drive the 10-year Treasury yield up and down, but one major force is inflation expectations. The higher the expectations for future rates of inflation, the higher the yields on the 10-year, and the higher the mortgage rate. With inflation proving stickier than expected and the market believing that rates will stay “higher for longer,” mortgage rate expectations have drifted higher for this year. What does this mean for affordability?
Expect Affordability to Improve Modestly by Year End
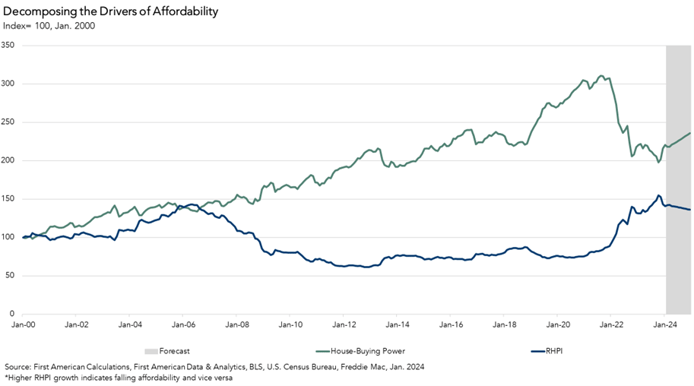
The RHPI measures affordability by adjusting the First American Data & Analytics House Price Index for purchasing power – how income levels and interest rates influence the amount one can borrow. These factors are expected to change in the following ways in 2024:
- Income Growth Expected to Moderate:
The labor market remained strong in January, as rising wages resulted in higher household income. Annual hourly wage growth increased by 4.4 percent compared with a year earlier, job growth remained steady, and the unemployment rate stayed low. The rise in wage growth contributed to a 3.9 percent year-over-year increase in median household income. The labor market faces a persistent labor shortage, putting upward pressure on household income, but that shortage has narrowed from the peak of 2022, and will likely continue to narrow in 2024, which should drag the pace of household income growth towards historical norms. - Mortgage Rates Projected to Retreat from 2023 Peaks:
Mortgage rates reached a recent peak of 7.6 percent in October 2023, but have since drifted below 7 percent. The average among mortgage industry forecasts projects that mortgage rates will end 2024 at approximately 6.25 percent, as inflation is expected to recede, and the Fed is expected to begin cutting rates. - Nominal House Prices Likely to Rise:
The housing market remains undersupplied relative to demand, which puts upward pressure on prices. As a result, annual nominal house price appreciation will likely continue to remain positive nationally, but return closer to the historical average of 3-to-4 percent, as the housing market adjusts to the reality of higher mortgage rates, and affordability constraints remain. The average of different industry forecasts suggests a 3.7 percent annual increase in nominal house price growth by the end of 2024.
Still Reason for Optimism
If mortgage rates fall to 6.25 percent by the end of 2024, household income grows at the pre-pandemic historical average of 2.9 percent compared with the end of 2023 and nominal house prices increase by 3.7 percent annually, affordability will improve by a little over 3 percent at the end of the year compared with January. Even modest improvements in housing affordability will be welcome news for buyers currently sitting on the sidelines. However, even at this level, affordability will remain nearly 38 percent worse than in February 2022, just before the Fed started increasing rates. The industry predicts that 2025 will bring even lower mortgage rates – the sooner the better for prospective home buyers.
Sources:
• First American Data & Analytics
• Freddie Mac
• Census Bureau
January 2024 Real House Price Index Highlights
The First American Data & Analytics’ Real House Price Index (RHPI) showed that in January 2024:
- Real house prices decreased 1.8 percent between December 2023 and January 2024.
- Real house prices increased 7.2 percent between January 2023 and January 2024..
- Consumer house-buying power, how much one can buy based on changes in income and mortgage rates, increased 2.1 percent between December 2023 and January 2024, and decreased 0.1 percent year over year.
- Median household income has increased 3.9 percent since January 2023 and 89.1 percent since January 2000.
- Real house prices are 40.7 percent more expensive than in January 2000.
- Unadjusted house prices are now 58.2 percent above the housing boom peak in 2006, while real, house-buying power-adjusted house prices are 1.6 percent below their 2006 housing boom peak.
January 2024 Real House Price State Highlights
- The five states with the greatest year-over-year increase in the RHPI are: South Dakota (+17.9 percent), New Mexico (+17.4 percent), New Jersey (+16.9 percent), Maine (+14.3), and Illinois (+14.0 percent).
- There were no states with a year-over-year decrease in the RHPI.
January 2024 Real House Price Local Market Highlights
- Among the Core Based Statistical Areas (CBSAs) tracked by First American Data & Analytics, the five markets with the greatest year-over-year increase in the RHPI are: Cincinnati (+13.1 percent), Hartford, Conn. (+11.7 percent), San Diego (+10.3 percent), Chicago (+10.2 percent), and Louisville, Ky. (+10.1 percent).
- There were no markets with a year-over-year decrease in the RHPI.
Next Release
The next release of the First American Data & Analytics’ Real House Price Index will take place the week of April 8, 2024.
About the First American Data & Analytics’ Real House Price Index
The traditional perspective on house prices is fixated on the actual prices and the changes in those prices, which overlooks what matters to potential buyers - their purchasing power, or how much they can afford to buy. First American Data & Analytics’ proprietary Real House Price Index (RHPI) adjusts prices for purchasing power by considering how income levels and interest rates influence the amount one can borrow.
The RHPI uses a weighted repeat-sales house price index that measures the price movements of single-family residential properties by time and across geographies, adjusted for the influence of income and interest rate changes on consumer house-buying power. The index is set to equal 100 in January 2000. Changing incomes and interest rates either increase or decrease consumer house-buying power. When incomes rise and mortgage rates fall, consumer house-buying power increases, acting as a deflator of increases in the house price level. For example, if the house price index increases by three percent, but the combination of rising incomes and falling mortgage rates increase consumer buying power over the same period by two percent, then the Real House Price index only increases by 1 percent. The Real House Price Index reflects changes in house prices, but also accounts for changes in consumer house-buying power.
Disclaimer
Opinions, estimates, forecasts and other views contained in this page are those of First American’s Chief Economist, do not necessarily represent the views of First American or its management, should not be construed as indicating First American’s business prospects or expected results, and are subject to change without notice. Although the First American Economics team attempts to provide reliable, useful information, it does not guarantee that the information is accurate, current or suitable for any particular purpose. © 2024 by First American. Information from this page may be used with proper attribution.


