School bells ringing don’t just mark the beginning of a new school year, but for those in housing, they also signal the end of the typical home-buying season, which begins in March. As the school year begins, the housing market is finishing the spring home-buying season with strong marks for affordability. Indeed, two of the three key drivers of the Real House Price Index (RHPI), household income and mortgage rates, continued to trend toward increased affordability in July. The 30-year, fixed-rate mortgage fell by 0.8 percentage points and household income increased 2.4 percent compared with July 2018. When household income rises and mortgage rates decline, consumer house-buying power increases.
“In a housing market with limited supply, a surge in demand from home buyers trying to take advantage of rising house-buying power can drive faster price appreciation, making further affordability gains more difficult.”
However, the third component of the RHPI, nominal house prices, experienced a year-over-year increase of 8.0 percent in July, decreasing affordability. Yet, even though nominal house prices increased, the RHPI declined 3.8 percent compared with one year ago. Affordability improved year-over-year as the increase in house-buying power more than offset the impact of higher nominal house prices. Given the home-buying season is coming to a close for the year, let’s consider how affordability changed during the 2019 home-buying season.
Did Affordability Spring Forward?
The home-buying season begins in the spring and then continues into the mid-summer months. Family vacations and preparation for the new school year typically bring the home-buying season to a close. In fact, according to data from DataTree by First American, 57 percent of all housing transactions annually occurred between March and August in 2018.
Between March and July 2019, overall affordability improved 2.7 percent. Consumer house-buying power fueled the affordability growth, increasing to $410,271, a 6.7 percent gain since the start of the home-buying season in March. Mortgage rates continued their spring swoon in July, falling to 3.77 percent, 0.5 percentage points lower than March. The decline in mortgage rates alone increased house-buying power by $23,900 since March 2019. Over the same period, household income grew by 0.4 percent, boosting consumer house-buying power by $1,600.
Cumulatively, overall consumer house-buying power increased by $25,500 in July compared with the beginning of the spring home-buying season in March. Once again, the growth in purchasing power was more than enough to offset the 3.8 percent gain in nominal house prices over the same time. So, nationally, affordability did spring forward during the 2019 home-buying season.
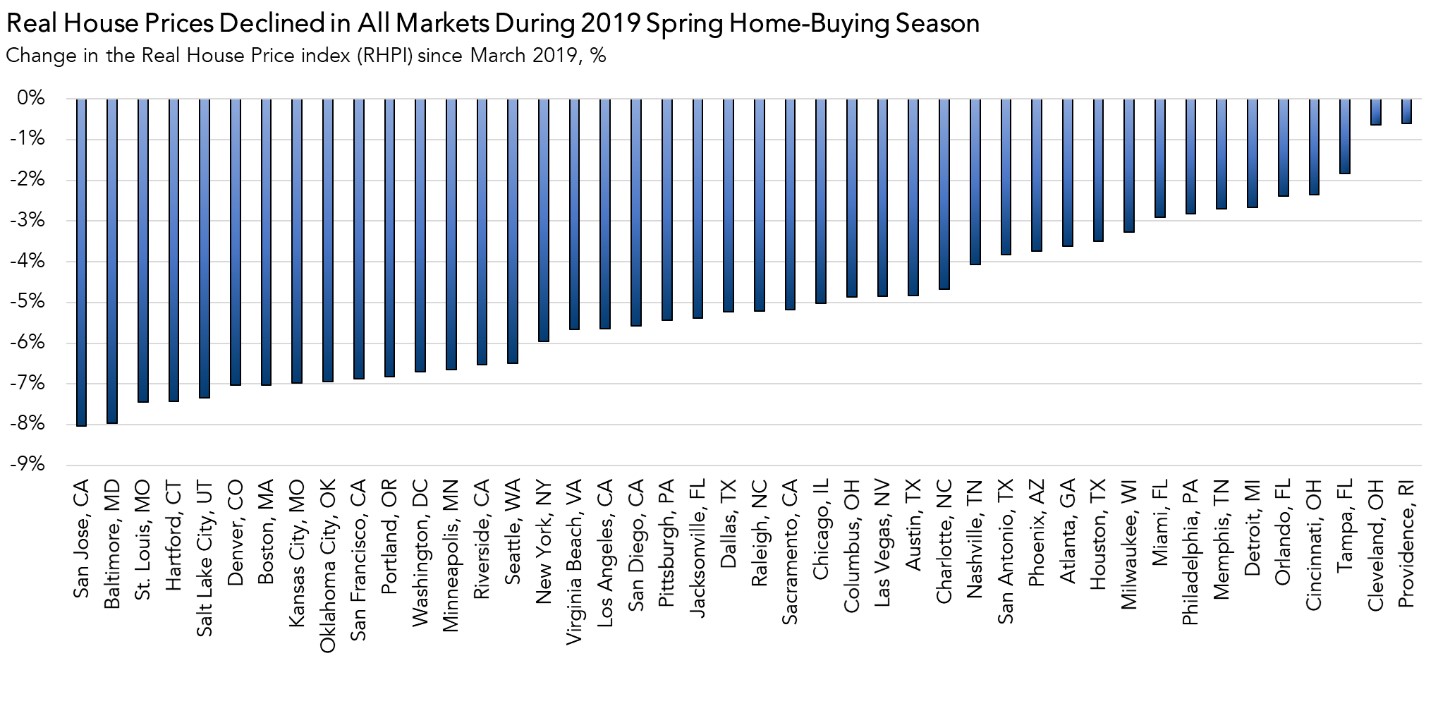
Affordability Improved Across All Cities in the RHPI
While affordability improved nationally, real estate is all about “location, location, location.” Of the 44 markets tracked in the RHPI, affordability improved in all of them compared with March 2019. The five markets with the greatest increase in affordability (measured by a decrease in RHPI value) during the 2019 spring home-buying season were:
1. San Jose, Calif. (-8.04 percent)
2. Baltimore (-7.97 percent)
3. St. Louis (-7.45 percent)
4. Hartford, Conn. (-7.43 percent)
5. Salt Lake City (-7.35 percent)
The surge in affordability offered home buyers a window of opportunity during the spring home-buying season. However, increased affordability results in more demand for homes, which puts upward pressure on nominal house prices. In fact, on a month-over-month basis, 25 of the 44 markets we track experienced declining affordability in July compared to June, indicating that the housing market is adjusting to the added demand. In a housing market with limited supply, a surge in demand from home buyers trying to take advantage of rising house-buying power can drive faster price appreciation, making further affordability gains more difficult.
The RHPI is updated monthly with new data. Look for the next edition of the RHPI the week of October 28, 2019.
Sources:
July 2019 Real House Price Index Highlights
The First American Real House Price Index (RHPI) showed that in July 2019:
- Real house prices increased 0.5 percent between June 2019 and July 2019.
- Real house prices declined 3.8 percent between July 2018 and July 2019.
- Consumer house-buying power, how much one can buy based on changes in income and interest rates, increased 0.5 percent between June 2019 and July 2019, and increased 12.2 percent year over year.
- Average household income has increased 2.4 percent since July 2018 and 56.6 percent since January 2000.
- Real house prices are 17.0 percent less expensive than in January 2000.
- While unadjusted house prices are now 7.4 percent above the housing boom peak in 2006, real, house-buying power-adjusted house prices remain 41.1 percent below their 2006 housing boom peak.
July Real House Price State Highlights
- The only state with a year-over-year increase in the RHPI is: Rhode Island (+0.7 percent).
- The five states with the greatest year-over-year decrease in the RHPI are: North Dakota (-9.7 percent), California (-9.1 percent), Wyoming (-9.0 percent), West Virginia (-8.7 percent), and New Mexico (-8.4 percent).
July 2019 Real House Price Local Market Highlights
- Among the Core Based Statistical Areas (CBSAs) tracked by First American, the only market with a year-over-year increase in the RHPI is: Providence, R.I. (+2.6 percent).
- Among the Core Based Statistical Areas (CBSAs) tracked by First American, the five markets with the greatest year-over-year decrease in the RHPI are: San Jose, Calif. (-15.5 percent), Seattle (-10.4 percent), San Francisco (-10.1 percent), Portland, Ore. (-9.5 percent), and Los Angeles (-9.1 percent).
About the First American Real House Price Index
The traditional perspective on house prices is fixated on the actual prices and the changes in those prices, which overlooks what matters to potential buyers - their purchasing power, or how much they can afford to buy. First American’s proprietary Real House Price Index (RHPI) adjusts prices for purchasing power by considering how income levels and interest rates influence the amount one can borrow.
The RHPI uses a weighted repeat-sales house price index that measures the price movements of single-family residential properties by time and across geographies, adjusted for the influence of income and interest rate changes on consumer house-buying power. The index is set to equal 100 in January 2000. Changing incomes and interest rates either increase or decrease consumer house-buying power. When incomes rise and mortgage rates fall, consumer house-buying power increases, acting as a deflator of increases in the house price level. For example, if the house price index increases by three percent, but the combination of rising incomes and falling mortgage rates increase consumer buying power over the same period by two percent, then the Real House Price index only increases by 1 percent. The Real House Price Index reflects changes in house prices, but also accounts for changes in consumer house-buying power.
Disclaimer
Opinions, estimates, forecasts and other views contained in this page are those of First American’s Chief Economist, do not necessarily represent the views of First American or its management, should not be construed as indicating First American’s business prospects or expected results, and are subject to change without notice. Although the First American Economics team attempts to provide reliable, useful information, it does not guarantee that the information is accurate, current or suitable for any particular purpose. © 2019 by First American. Information from this page may be used with proper attribution.


