In July, housing affordability continued its decline as year-over-year nominal house price appreciation reached a record 20 percent, vastly outpacing the increase in house-buying power compared with a year ago. The Real House Price Index (RHPI) measures affordability in the context of changes in consumer house-buying power, incorporating changes in household income, mortgage rates and nominal house prices. House-buying power, how much one can buy based on changes in income and interest rates, increased by 3.8 percent in July compared with one year ago, propelled by lower mortgage rates and higher household income.
“The severe supply-demand imbalance in the housing market continues to fuel record-breaking house price appreciation across the country, yet lower mortgage rates and higher incomes mean homes are more affordable today than at their prior peaks in every market we track.”
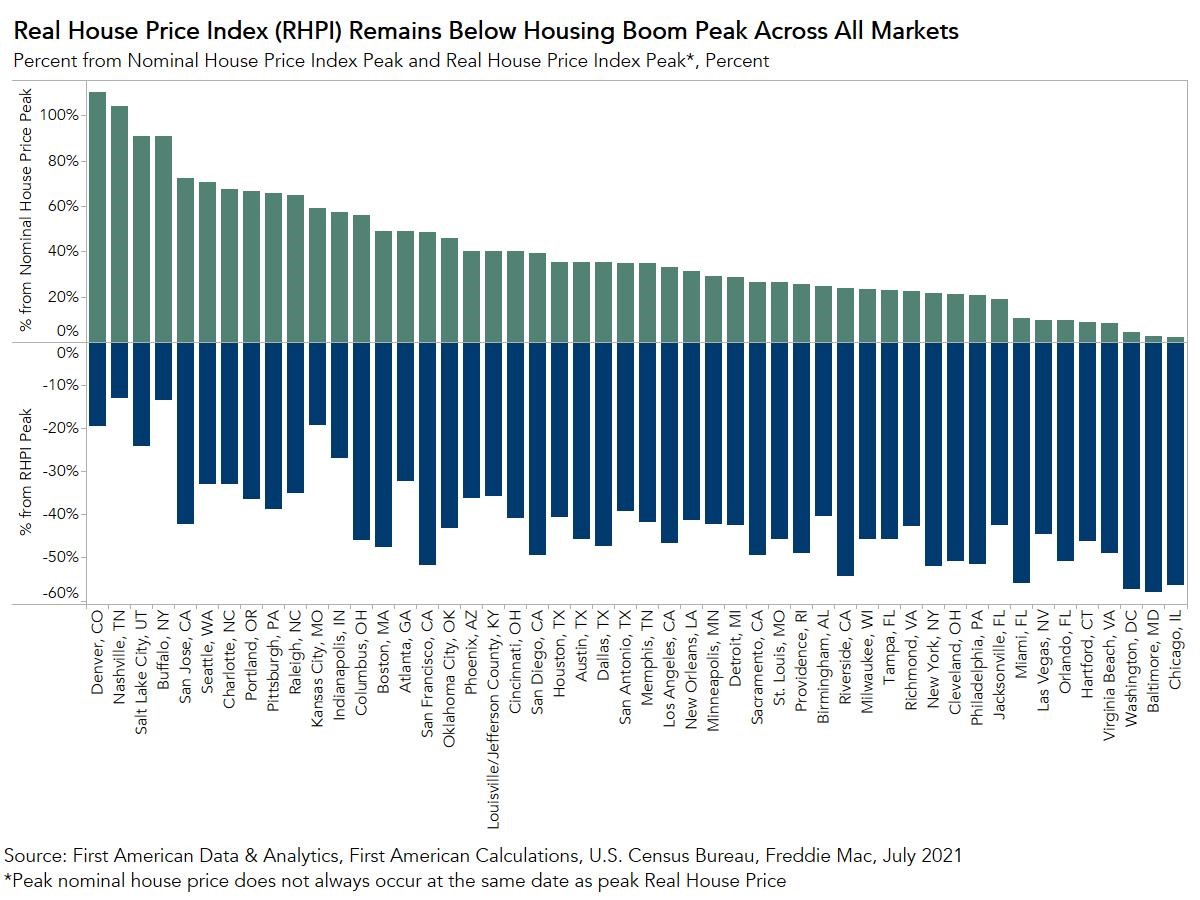
However, while affordability declined again in July, it’s helpful to put affordability in historical context. Nationally, nominal house prices in July were 35 percent higher than at the housing boom peak for prices in 2006, yet real, house-buying power-adjusted house prices remain nearly 38 percent below their 2006 housing boom peak. But real estate is local, and the recovery from the housing boom and crash varies by market, so where has affordability improved the most compared with the prior peak?
Home Prices Are More Affordable Than During the Previous Housing Peak in All 50 Top Markets
For nominal house prices, all 50 markets we track have surpassed their previous housing peaks, but some markets have only done so recently. For example, Chicago (2 percent), Baltimore (3 percent), Washington (4 percent), Virginia Beach, Va. (8 percent) and Hartford, Conn. (9 percent) have only modestly surpassed their previous nominal price peaks. The remaining 45 markets have surpassed their peaks by at least 10 percent.
Yet, the level of nominal house prices doesn’t tell the affordability story. While nominal house prices have increased, house-buying power has also increased because of a long-run decline in mortgage rates and the slow, but steady growth of household income. House-buying power matters because people typically buy homes based on how much it costs each month to make a mortgage payment, not the price of the home. Mortgage rates are generally the same across the country, so the long-run decline in mortgage rates boosts affordability equally in each market. Household income growth and nominal house prices, on the other hand, differ from market to market, so affordability varies geographically as well. Based on the house-buying power-adjusted RHPI, we find that affordability is higher in all 50 markets compared to their previous respective RHPI peaks.
Homes in Chicago are 56 percent More Affordable Today than in July 2006
According to the Real House Price Index, housing in Chicago was least affordable in July 2006, when mortgage rates were approximately 6.7 percent. Since then, mortgage rates have declined to an average of 2.9 percent in July of this year. At the same time, household income in Chicago has increased by approximately 50 percent. The decline in mortgage rates and steady rise in household income resulted in a 135 percent increase in house-buying power, which was more than enough to offset the 2.6 percent increase in nominal house price growth. As a result, homes in Chicago are 56 percent more affordable today than they were in July 2006.
On average, the markets we track in the RHPI are more than 40 percent more affordable today than at their respective prior peaks. The severe supply-demand imbalance in the housing market continues to fuel record-breaking house price appreciation across the country, yet lower mortgage rates and higher incomes mean homes are more affordable today than at their prior peaks in every market we track.
Top 5 Markets Where Affordability Has Improved the Most Since Their Prior Peak
- Baltimore (58 percent from peak)
- Washington (57 percent from peak)
- Chicago (56 percent from peak)
- Miami (56 percent from peak)
- Riverside, Calif. (54 percent from peak)
Top 5 Markets Where Affordability Has Improved the Least Since Their Prior Peak
- Nashville, Tenn. (13 percent from peak)
- Buffalo, N.Y. (13 percent from peak)
- Kansas City, Mo. (19 percent from peak)
- Denver (20 percent from peak)
- Salt Lake City (24 percent from peak)
What Goes Up, May Continue to Go Up
While nominal house prices continue to break records, affordability remains vastly improved in most markets relative to their previous peaks. The pace of house price appreciation is widely expected to cool, but still increase in the months ahead. If prices continue to outpace house-buying power, affordability will suffer, but we’re still a long way from 2006.
For more analysis of affordability, please visit the Real House Price Index. The RHPI is updated monthly with new data. Look for the next edition of the RHPI the week of October 25, 2021.
Sources:
July 2021 Real House Price Index Highlights
The First American Real House Price Index (RHPI) showed that in July 2021:
- Real house prices increased 0.2 percent between June 2021 and July 2021.
- Real house prices increased 16.0 percent between July 2020 and July 2021.
- Consumer house-buying power, how much one can buy based on changes in income and interest rates, increased 1.63 percent between June 2021 and July 2021, and increased 3.8 percent year over year.
- Median household income has increased 1.9 percent since July 2020 and 64.9 percent since January 2000[1].
- Real house prices are 11.4 percent less expensive than in January 2000.
- While unadjusted house prices are now 34.9 percent above the housing boom peak in 2006, real, house-buying power-adjusted house prices remain 37.8 percent below their 2006 housing boom peak.
July 2021 Real House Price State Highlights
- The five states with the greatest year-over-year increase in the RHPI are: Arizona (+24.8 percent), Vermont (+21.8 percent), Nevada (+20.2 percent), Connecticut (+19.6 percent), and Georgia (+18.1 percent).
- There were no states with a year-over-year decrease in the RHPI.
July 2021 Real House Price Local Market Highlights
- Among the Core Based Statistical Areas (CBSAs) tracked by First American, the five markets with the greatest year-over-year increase in the RHPI are: Phoenix (+28.3 percent), Las Vegas (+21.7 percent), Tampa, Fla. (+21.4 percent), Jacksonville, Fla. (+21.4 percent), and Kansas City, Mo. (+21.1 percent).
- Among the Core Based Statistical Areas (CBSAs) tracked by First American, there were no markets with a year-over-year decrease in the RHPI.
About the First American Real House Price Index
The traditional perspective on house prices is fixated on the actual prices and the changes in those prices, which overlooks what matters to potential buyers - their purchasing power, or how much they can afford to buy. First American’s proprietary Real House Price Index (RHPI) adjusts prices for purchasing power by considering how income levels and interest rates influence the amount one can borrow.
The RHPI uses a weighted repeat-sales house price index that measures the price movements of single-family residential properties by time and across geographies, adjusted for the influence of income and interest rate changes on consumer house-buying power. The index is set to equal 100 in January 2000. Changing incomes and interest rates either increase or decrease consumer house-buying power. When incomes rise and mortgage rates fall, consumer house-buying power increases, acting as a deflator of increases in the house price level. For example, if the house price index increases by three percent, but the combination of rising incomes and falling mortgage rates increase consumer buying power over the same period by two percent, then the Real House Price index only increases by 1 percent. The Real House Price Index reflects changes in house prices, but also accounts for changes in consumer house-buying power.
Disclaimer
Opinions, estimates, forecasts and other views contained in this page are those of First American’s Chief Economist, do not necessarily represent the views of First American or its management, should not be construed as indicating First American’s business prospects or expected results, and are subject to change without notice. Although the First American Economics team attempts to provide reliable, useful information, it does not guarantee that the information is accurate, current or suitable for any particular purpose. © 2021 by First American. Information from this page may be used with proper attribution.
[1] This release includes a revision to the annual income series using the 2020 Current Population Survey Annual Social and Economic Supplement (CPS ASEC)


