Throughout 2020, falling mortgage rates have been the strongest influence on housing affordability trends, even helping fuel the housing market’s impressive recovery and resilience to the continuing economic fallout from the coronavirus pandemic. Mortgage rates began declining in January 2020 and even dropped below 3 percent for the first time ever in August. But, as mortgage rates have fallen and the housing market has recovered amid strong demand and historically low supply, nominal house price appreciation has rapidly accelerated. In August, the dynamics powering affordability may have reached a tipping point.
“You can only buy what you can afford to pay per month. In August, rising demand for homes against limited supply accelerated house price appreciation, which overcame the affordability boost from rising house-buying power for the first time in 2020.”
The End of the Great Mortgage Rate-Powered Affordability Boost?
Understanding the dynamics that influence consumer house-buying power – how much home one can buy based on changes in income and interest rates – provides helpful perspective on the housing market. When incomes rise, consumer house-buying power increases. When mortgage rates or nominal house prices rise, consumer house-buying power declines. Our Real House Price Index (RHPI) uses consumer house-buying power to adjust nominal house prices, offering insight into affordability.
For example, according to our RHPI, real house prices decreased 5.7 percent year over year in August, marking a gain in affordability compared to a year ago. However, August also marks the first time since December 2019 that the RHPI increased on a month-over-month basis, indicating a more immediate-term decline in affordability, albeit small at 0.15 percent. Relative to July 2020, mortgage rates fell by 0.08 percentage points and household income increased by 0.27 percent. While these two forces improved house-buying power, it was not enough to offset the negative impact from nominal house price appreciation, which increased by 1.5 percent between July and August. Ultimately, this “tug-of-war” between house-buying power and nominal house prices determines the fate of real house prices, and this month, nominal house price appreciation won.
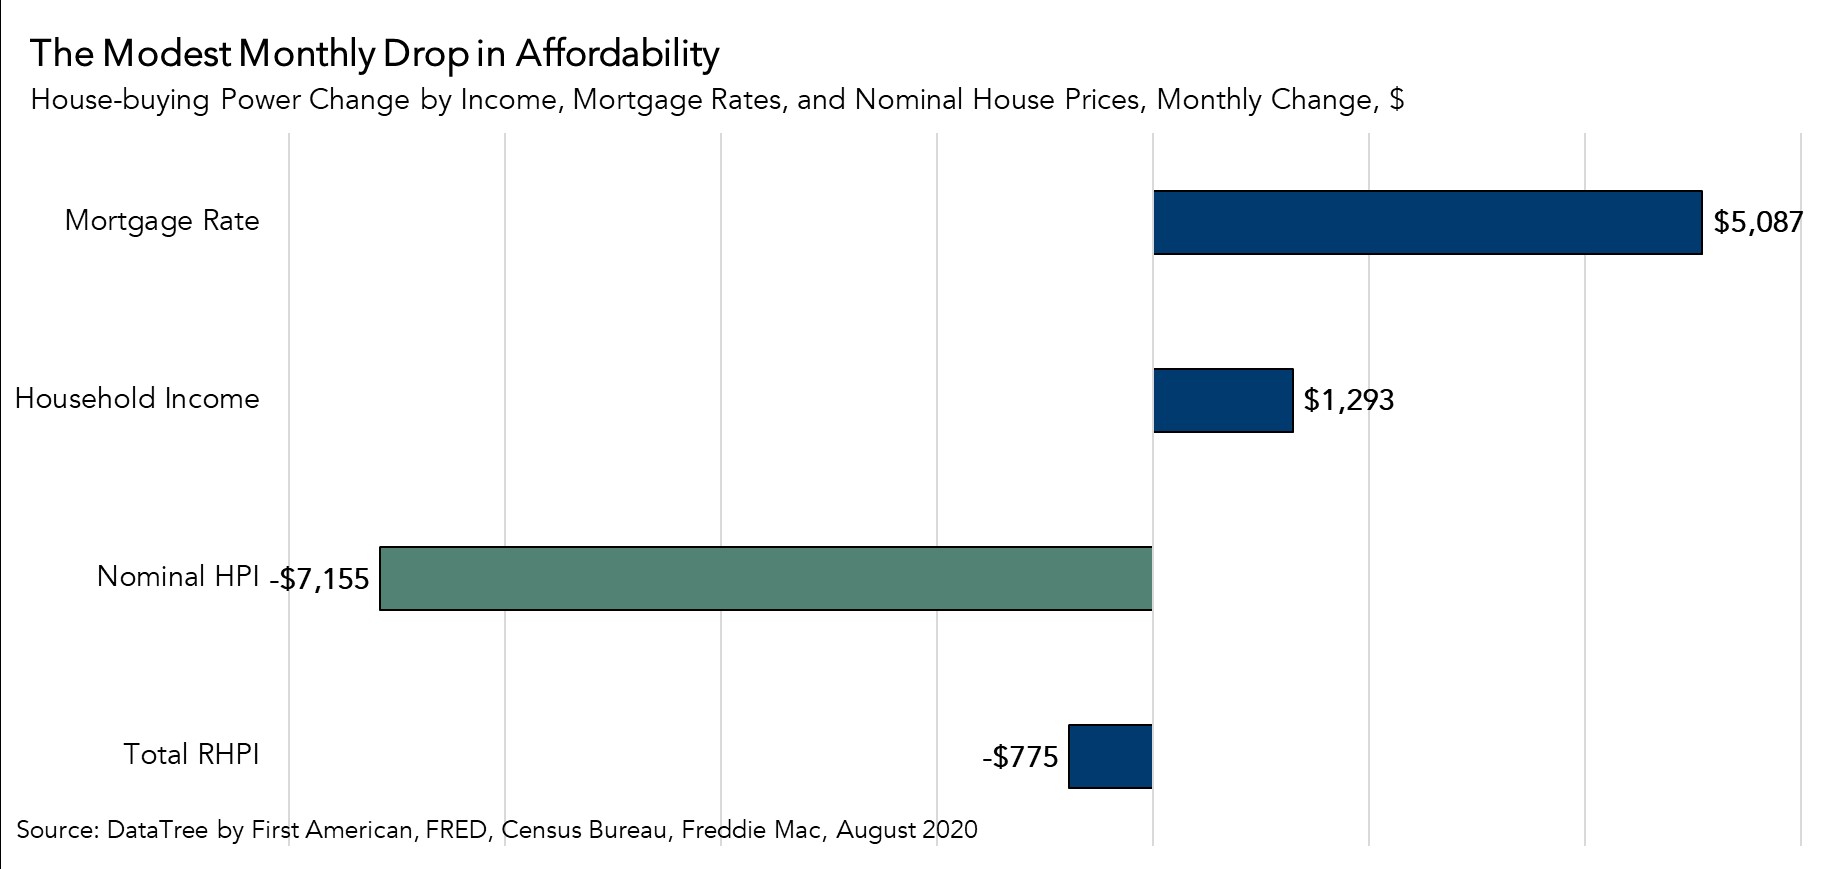
Nominal House Price Appreciation Outpaces Mortgage Rate and Income Growth Bump in August
From July 2020 to August 2020, nominal house prices increased by 1.5 percent, reducing affordability. In July 2020, the median household income was approximately $71,180, which could purchase a home valued at $487,750, assuming a five percent down payment. That home increased in value by 1.5 percent to roughly $494,900 in August, an increase of $7,155.
According to our RHPI, the 0.08 percentage point decline in mortgage rates from July 2020 to August 2020 translates to a $5,087 improvement in house-buying power. As rates have fallen, household incomes for those who are still employed continued to rise modestly. In August, the growth in household income increased consumer house-buying power by an additional $1,293. The combined effect of falling rates and rising household income in August was a $6,380 increase in house-buying power. The $7,155 increase in the home’s nominal price outpaced the $6,380 increase in house-buying power, so the prospective homebuyer lost approximately $775 in purchasing power between July and August 2020.
Does the Tipping Point Signal a Shift in Affordability Trends?
Focusing on nominal house price fluctuations alone as an indication of changing affordability, or even the relationship between nominal house price growth and income growth, overlooks what matters more to potential buyers – house-buying power. You can only buy what you can afford to pay per month. In August, rising demand for homes against limited supply accelerated house price appreciation, which overcame the affordability boost from rising house-buying power for the first time in 2020.
The good news is that affordability remains significantly higher than one year ago, mostly due to falling rates. One month does not make a trend, but this month’s decline in affordability signals that the current dynamics producing faster house price appreciation may begin to erode the affordability gains of recent years.
For more analysis of affordability, please visit the Real House Price Index.
The RHPI is updated monthly with new data. Look for the next edition of the RHPI the week of November 23, 2020.
Sources:
August 2020 Real House Price Index Highlights
The First American Real House Price Index (RHPI) showed that in August 2020:
- Real house prices increased 0.15 percent between July 2020 and August 2020.
- Real house prices declined 5.7 percent between August 2019 and August 2020.
- Consumer house-buying power, how much one can buy based on changes in income and interest rates, increased 1.3 percent between July 2020 and August 2020, and increased 15.6 percent year over year.
- Median household income has increased 6.1 percent since August 2019 and 71.7 percent since January 2000.
- Real house prices are 26.8 percent less expensive than in January 2000.
- While unadjusted house prices are now 15.3 percent above the housing boom peak in 2006, real, house-buying power-adjusted house prices remain 48.5 percent below their 2006 housing boom peak.
August 2020 Real House Price State Highlights
- The three states with a year-over-year increase in the RHPI are: Wyoming (+1.9 percent), Oklahoma (+1.5 percent), and Ohio (+0.5 percent).
- The five states with the greatest year-over-year decrease in the RHPI are: New Hampshire (-9.5 percent), Massachusetts (-8.9 percent), California (-8.6 percent), Maryland (-8.4 percent), and Nevada (-7.7 percent).
August 2020 Real House Price Local Market Highlights
- Among the Core Based Statistical Areas (CBSAs) tracked by First American, the five markets with the greatest year-over-year increase in the RHPI are: Pittsburgh (+4.9 percent), Cleveland (+3.4 percent), Seattle (+2.1 percent), San Antonio (+2.0 percent), and New Orleans (+1.8 percent).
- Among the Core Based Statistical Areas (CBSAs) tracked by First American, the five markets with the greatest year-over-year decrease in the RHPI are: San Francisco (-14.6 percent), San Jose, Calif. (-12.7 percent), Boston (-11.6 percent), San Diego (-9.7 percent), and Baltimore (-9.4 percent).
About the First American Real House Price Index
The traditional perspective on house prices is fixated on the actual prices and the changes in those prices, which overlooks what matters to potential buyers - their purchasing power, or how much they can afford to buy. First American’s proprietary Real House Price Index (RHPI) adjusts prices for purchasing power by considering how income levels and interest rates influence the amount one can borrow.
The RHPI uses a weighted repeat-sales house price index that measures the price movements of single-family residential properties by time and across geographies, adjusted for the influence of income and interest rate changes on consumer house-buying power. The index is set to equal 100 in January 2000. Changing incomes and interest rates either increase or decrease consumer house-buying power. When incomes rise and mortgage rates fall, consumer house-buying power increases, acting as a deflator of increases in the house price level. For example, if the house price index increases by three percent, but the combination of rising incomes and falling mortgage rates increase consumer buying power over the same period by two percent, then the Real House Price index only increases by 1 percent. The Real House Price Index reflects changes in house prices, but also accounts for changes in consumer house-buying power.
Disclaimer
Opinions, estimates, forecasts and other views contained in this page are those of First American’s Chief Economist, do not necessarily represent the views of First American or its management, should not be construed as indicating First American’s business prospects or expected results, and are subject to change without notice. Although the First American Economics team attempts to provide reliable, useful information, it does not guarantee that the information is accurate, current or suitable for any particular purpose. © 2020 by First American. Information from this page may be used with proper attribution.


