In May, housing affordability fell relative to one month ago, as two of the three key drivers of the Real House Price Index (RHPI), nominal house prices and mortgage rates reduced house-buying power by 0.7 percent. Nominal house price growth ticked up 0.6 percent compared with one month ago, while the average 30-year, fixed mortgage rate increased by 0.08 percentage points. Nominal house price growth has re-accelerated in recent months and even reached a new peak in May. While median household incomes increased by 0.2 percent compared with April, it was not enough to offset the affordability dampening impact from higher house prices and mortgage rates.
“Recent house price data is hinting that house prices may also be past the trough, as tight supply along with continued demand for homeownership are driving prices higher again.”
House price movements vary by market, but it’s clear that house price growth in many markets has resumed. In fact, nominal house prices increased on a month-over-month basis in 43 of the top 50 markets we track in May. While many expected that a higher mortgage rate environment would prompt house prices to adjust downward, the lack of housing inventory amid a resilient economy is keeping a floor on how low prices can go. Of course, these dynamics vary dramatically by market.
Boom-and-Bust Markets
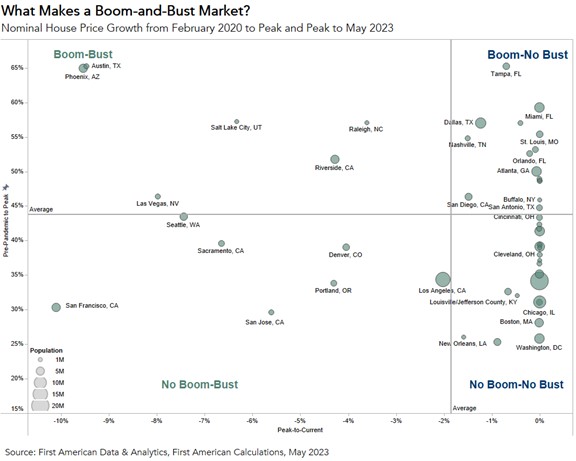
To gain a better understanding of house price dynamics at the market level, we break out the top 50 U.S. markets into four categories
- Boom-Bust: Examples of boom-bust markets include Phoenix and Austin, Texas. House prices increased 65 percent from February 2020 to the peak in May of 2022 for both markets, but have since declined by 9.5 percent. Both markets are emblematic of the expression – the higher they rise, the harder they fall. Demand skyrocketed, partially because of significant net-in migration to these markets over the course of the pandemic. Of the top 50 markets we track, Austin’s population grew the most and Phoenix’s population grew the eleventh most from 2021 to 2022. The swift pullback in demand due to declining affordability is dragging down house prices.
- Boom-No Bust: Tampa, Fl. and Miami are examples of a boom-no bust market. In fact, house prices have yet to decline in Miami, and have only declined by 1 percent in Tampa. Since the start of the pandemic, Miami house prices have increased by 59 percent, while Tampa has increased by an impressive 65 percent. The Florida housing market is holding up better than most of the country, in part, because of the prevalence of cash buyers, who are not deterred by rising mortgage rates, making demand more resilient.
- No Boom-Bust: The markets that dominate the no boom-bust category are concentrated on the West Coast. San Jose, Calif, San Francisco, and Seattle all fall into this category.
- No Boom-No Bust: New York, Boston, and Chicago are examples of no boom-no bust markets. The pre-pandemic-to-peak growth rate in New York was 34 percent, muted compared with other top markets. House prices have not yet declined in New York, in part because there was less of a boom during the pandemic, as many residents flocked to the suburbs from the density of the city. These markets did not rise as fast, and subsequently experienced less of a fall.
Have House Prices Bottomed Out?
Recent house price data is hinting that house prices may also be past the trough, as tight supply along with continued demand for homeownership are driving prices higher again. Yet, it’s too soon to make the call that house prices have bottomed. Higher mortgage rates continue to put pressure on affordability, and house prices may still need to adjust down to reflect the reality of higher rates. As this analysis shows, real estate is still very much local, and it seems high-priced markets may be more vulnerable to a downturn in prices.
For more analysis of affordability, please visit the Real House Price Index. The RHPI is updated monthly with new data. Look for the next edition of the RHPI the week of August 28, 2023.
[1] If a market is above the average rate of nominal house price from 2020 until the peak, then it is considered a pandemic “boom” market. If a market is below the average rate of growth from peak-to-May 2023, then that is considered a bust market. The average pre-pandemic to peak growth rate was 44 percent, while the average peak-to-current growth was -2 percent.
Sources:
May 2023 Real House Price Index Highlights
The First American Real House Price Index (RHPI) showed that in May 2023:
- Real house prices increased 1.3 percent between April 2023 and May 2023.
- Real house prices increased 11.7 percent between May 2022 and May 2023.
- Consumer house-buying power, how much one can buy based on changes in income and mortgage rates, decreased 0.7 percent between April 2023 and May 2023, and decreased 9.0 percent year over year.
- Median household income has increased 3.6 percent since May 2022 and 81.9 percent since January 2000.
- Real house prices are 36.6 percent more expensive than in January 2000.
- Unadjusted house prices are now 51.2 percent above the housing boom peak in 2006, while real, house-buying power-adjusted house prices are 4.4 percent below their 2006 housing boom peak.
May 2023 Real House Price State Highlights
- The five states with the greatest year-over-year increase in the RHPI are: Illinois (+19.4 percent), New Hampshire (+18.9 percent), New Jersey (+18.8 percent), Wisconsin (+18.5 percent), and Maryland (+17.6 percent).
- There were no states with a year-over-year decrease in the RHPI.
May 2023 Real House Price Local Market Highlights
- Among the Core Based Statistical Areas (CBSAs) tracked by First American, the five markets with the greatest year-over-year increase in the RHPI are: St. Louis (+27.0 percent), Miami (+24.4 percent), Chicago (+20.5 percent), Hartford, Conn. (+20.2 percent), and San Antonio (+20.0 percent).
- Among the Core Based Statistical Areas (CBSAs) tracked by First American, the only market with a year-over-year decrease in the RHPI is Salt Lake City (-3.2 percent).
About the First American Real House Price Index
The traditional perspective on house prices is fixated on the actual prices and the changes in those prices, which overlooks what matters to potential buyers - their purchasing power, or how much they can afford to buy. First American’s proprietary Real House Price Index (RHPI) adjusts prices for purchasing power by considering how income levels and interest rates influence the amount one can borrow.
The RHPI uses a weighted repeat-sales house price index that measures the price movements of single-family residential properties by time and across geographies, adjusted for the influence of income and interest rate changes on consumer house-buying power. The index is set to equal 100 in January 2000. Changing incomes and interest rates either increase or decrease consumer house-buying power. When incomes rise and mortgage rates fall, consumer house-buying power increases, acting as a deflator of increases in the house price level. For example, if the house price index increases by three percent, but the combination of rising incomes and falling mortgage rates increase consumer buying power over the same period by two percent, then the Real House Price index only increases by 1 percent. The Real House Price Index reflects changes in house prices, but also accounts for changes in consumer house-buying power.
Disclaimer
Opinions, estimates, forecasts and other views contained in this page are those of First American’s Chief Economist, do not necessarily represent the views of First American or its management, should not be construed as indicating First American’s business prospects or expected results, and are subject to change without notice. Although the First American Economics team attempts to provide reliable, useful information, it does not guarantee that the information is accurate, current or suitable for any particular purpose. © 2023 by First American. Information from this page may be used with proper attribution.


