Baby boomers – those born between 1946 and 1964 – have steered economic trends for decades and have the highest rate of homeownership in the country, approximately 80 percent. Now, as the oldest members of the generation edge into their 70s, they are deciding to stay in their homes. According to a Realtor.com housing shortage survey, boomers have the least interest in selling their home. Approximately 85 percent of baby boomers surveyed indicated they are not planning to sell their home in the next year. The main reason, according to the survey, is that their current home meets the needs of their family.
“Aging in place” is not a foreign concept to the housing market. However, the housing market has never experienced an increase in the population of 55 to 74 year olds of this magnitude. In the last 30 years, this population increased more than 30 percent. This may pose an issue for housing affordability as a tight housing market continues to get tighter, driving up prices.
“With baby boomers living longer and staying in their homes, and the housing market facing a housing shortage, the need for new construction is more important than ever.”
It’s no secret that millennial demand for housing continues to rise. There were 83.1 million millennials born between 1982 and 2000, and many are now looking to enter the housing market. There are 75.4 million baby boomers, and many indicate they have no intention of selling their homes. So, when it comes to housing, millennials would benefit from boomers selling their homes and adding more supply to the market, but that appears unlikely.
Consider that the share of baby boomer homeowner households has stayed fairly constant. In 2000, the share of baby boomer homeowners was 43.5 percent. In 2010, that number fell slightly to 42 percent, and has since stayed at 41 percent. But, are there markets where the share of baby boomer homeowners is declining, possibly signaling an uptick in future housing supply?
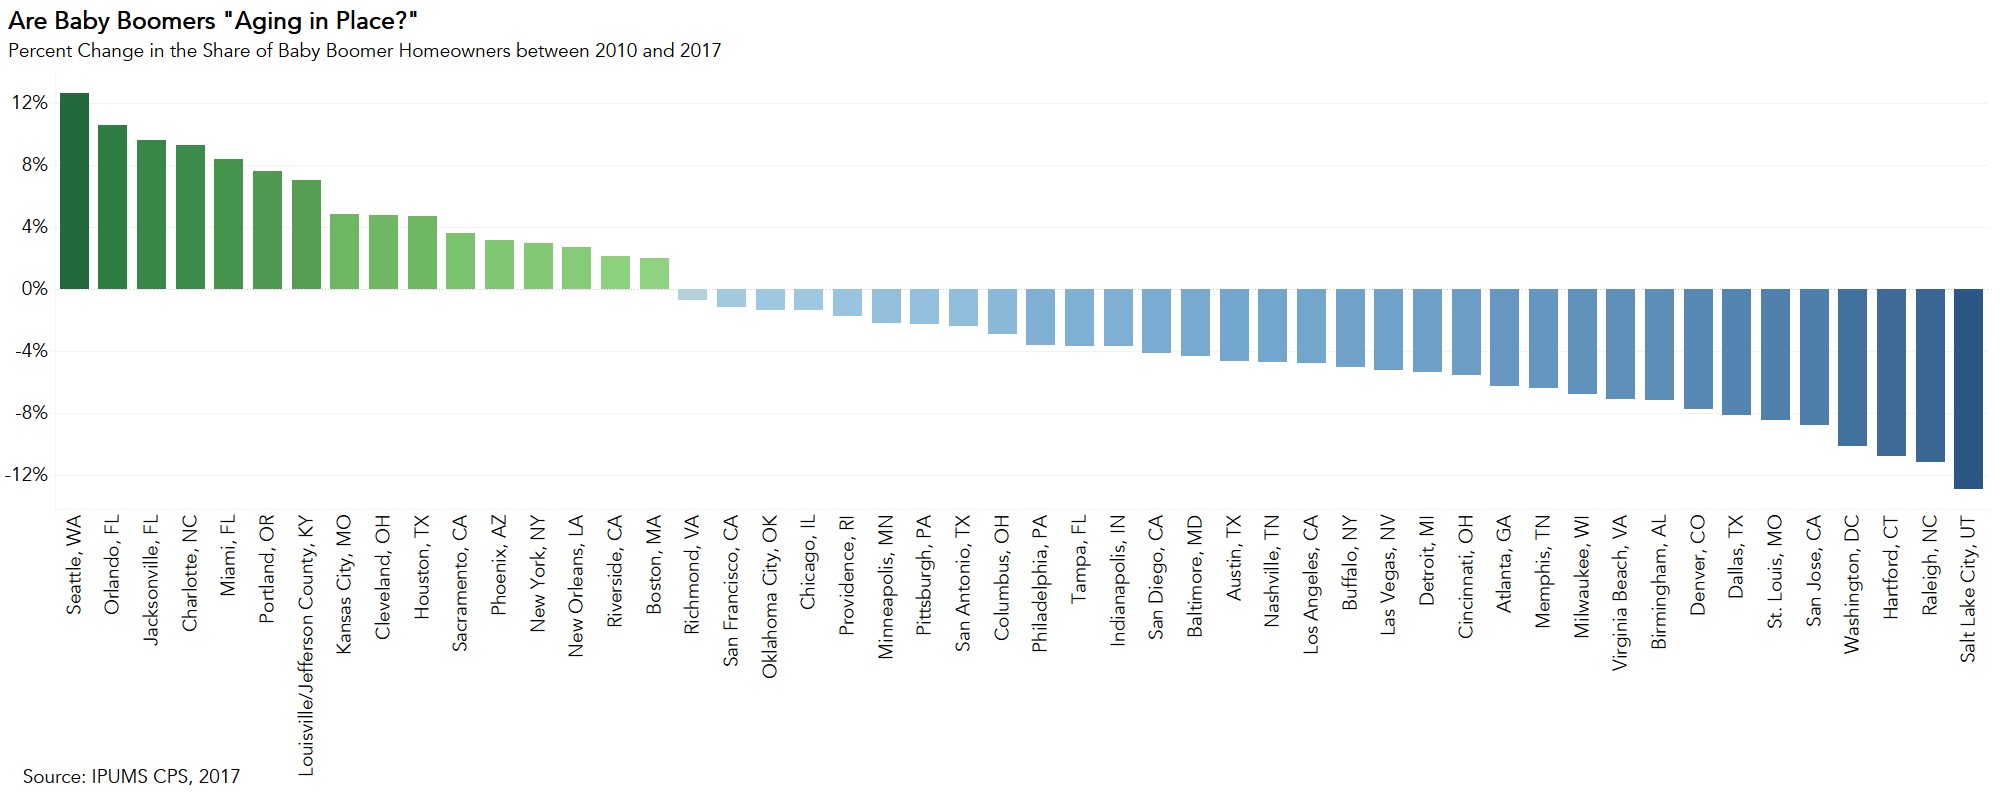
Using the top 50 largest cities from the 2017 U.S. Census Bureau Current Population Survey, we identified cities with the largest decreases in the share of homeowners that are baby boomers between 2010 and 2017.
The top 5 cities where baby boomer homeownership decreased the most from 2010 to 2017:
- Salt Lake City, Utah
- Raleigh, NC
- Hartford, CT
- Washington, DC
- San Jose, CA
Salt Lake City, the market with the largest drop, experienced a 12.9 percent fall in baby boomer homeownership. The bottom five markets’ share of baby boomer homeowners fell an average of 10.7 percent in 2017 from 2010.
The top 5 cities where baby boomer homeownership increased the most from 2010 to 2017:
- Seattle, Washington
- Orlando, FL
- Jacksonville, FL
- Charlotte, NC
- Miami, FL
In the top market, Seattle, baby boomer homeownership increased from 26.3 percent in 2010 to 39.0 percent in 2017. The top five markets experienced an average increase of 10.1 percent in baby boomer homeownership in the seven-year period.
2010-2017
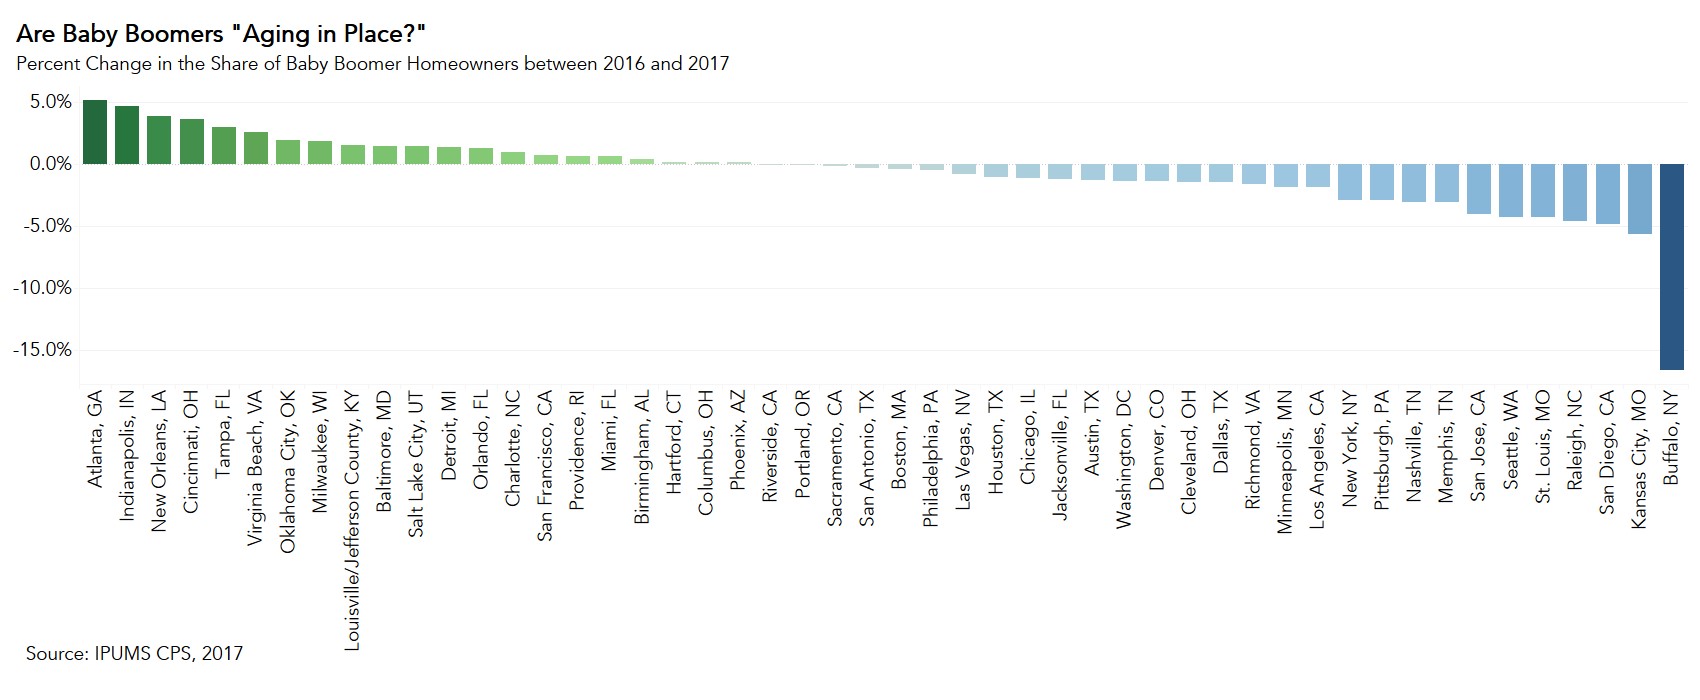
The chart below shows the annual percent change in the share of baby boomer homeowners for the most recent data, 2016 to 2017. Interestingly, among the top 50 markets, 21 show increasing homeownership for baby boomers.
2016-2017
In 2017, there were approximately 36 million baby boomer homeowner households in the United States, which is 6 percent more than in 2000. As a point of reference, the silent generation had 24 million homeowner households when they were the age of the oldest baby boomer. That’s a difference of 12 million homeowner households. With baby boomers living longer and staying in their homes, and the housing market facing a housing shortage, the need for new construction is more important than ever.
Odeta Kushi contributed to this article.