With cherry blossoms in Washington D.C. and warm weather everywhere else just around the corner, it means the spring home-buying season is upon us, right? What better rite of homeownership passage than the Sunday open house on a beautiful spring day? It’s a popular way to spend a Sunday, even if you aren’t really serious about buying, and are just snooping around the neighbor’s house before the sale.
Well, for this housing economist, the answer is not spring home-buying fever. I’ll get to that in April. Rather, later this month, the Census Bureau will release its latest annual Current Population Survey (CPS) public-use micro sample data for 2015. Why is this important, you ask? Because this is the data that we use to understand the underlying demographic and economic forces that influence homeownership decisions. This is the key resource we use to create our Homeownership Progress Index (HPRI), which we will update with 2015 data and a geographic extension to include major metropolitan areas. This is the data we use to understand the state of homeownership and the progress households are making toward achieving the American Dream.
"As the reigns of our society are turned over to Millennials, their lifestyle and economic choices will dictate what happens to homeownership in the coming decades."
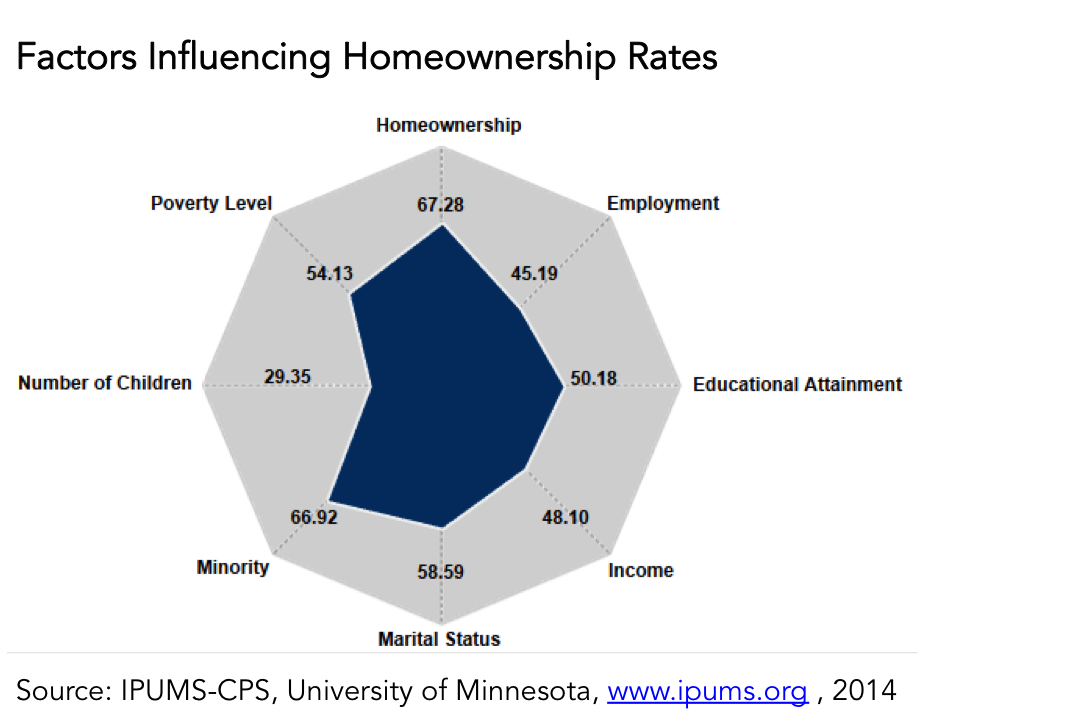
Last year, we released the inaugural HPRI, in which we introduced the index and the underlying demographic, lifestyle, and economic factors that influence homeownership – the indexed homeownership rate itself, the employment rate, the share of household educational attainment at or above a college degree, average income, the share of married households, the share of minority households, the average number of children in the family and the poverty rate. The index measures each attribute on a scale of 0-to-100 relative to the lowest and highest level of the attribute found among all states between 1990 and the most current year. For example, let’s look at the educational attainment index. Washington D.C. in 2014 had an educational attainment index score of 100. That means Washington D.C. in 2014 had the highest level of educational attainment among all the states we have measured since 1990. The educational attainment index scores for the other states are all relative to Washington D.C.’s score of 100 in 2014.
The graphic below shows the national indices, which are the state population-weighted average of all the underlying states. For the educational attainment index to equal 100 nationally, all the underlying states would need to have the same level of educational attainment as Washington D.C. in 2014. As one can see, the national composite attribute indices are not close to 100, indicating the wide degree of variation that we observe across states. Visit the HPRI report page for more detailed information on the indices and to look at them by state and year.

It’s been widely reported that homeownership rates have slipped from their peak. But, based on our HPRI, we believe the reason homeownership has slipped is not solely because of the economic conditions facing American households – increased unemployment, household wage stagnation – but also because of large-scale demographic changes that are only just beginning to influence homeownership. Increasing educational attainment, delayed marriage and delaying or even deciding not to start a family all have profound impacts on our desire to own a home.
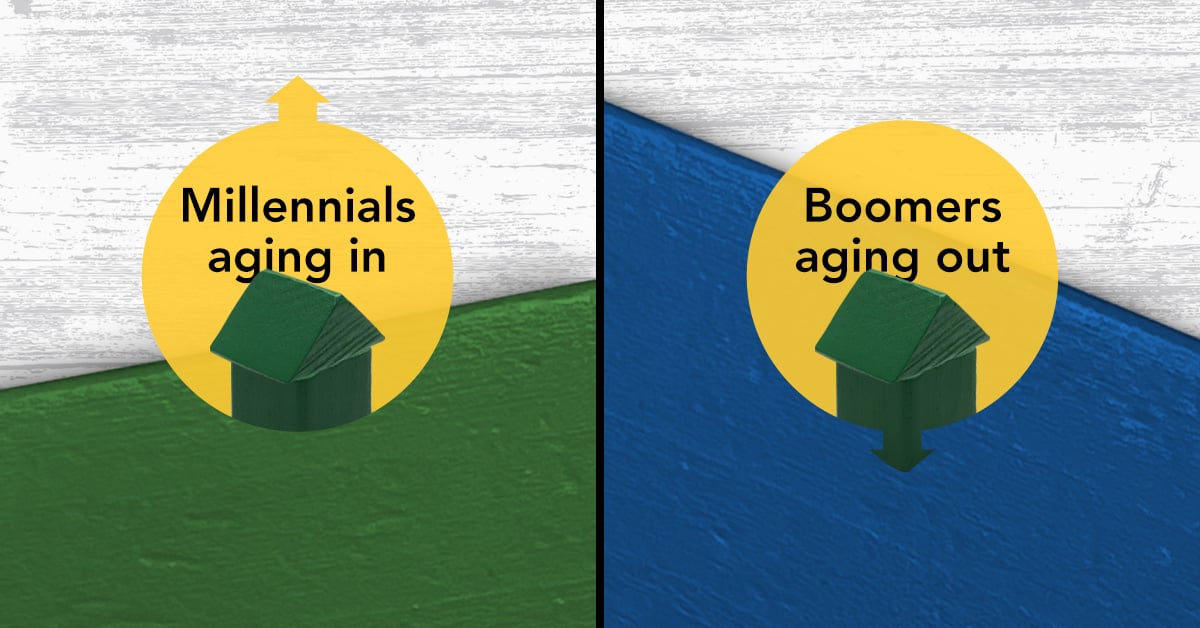
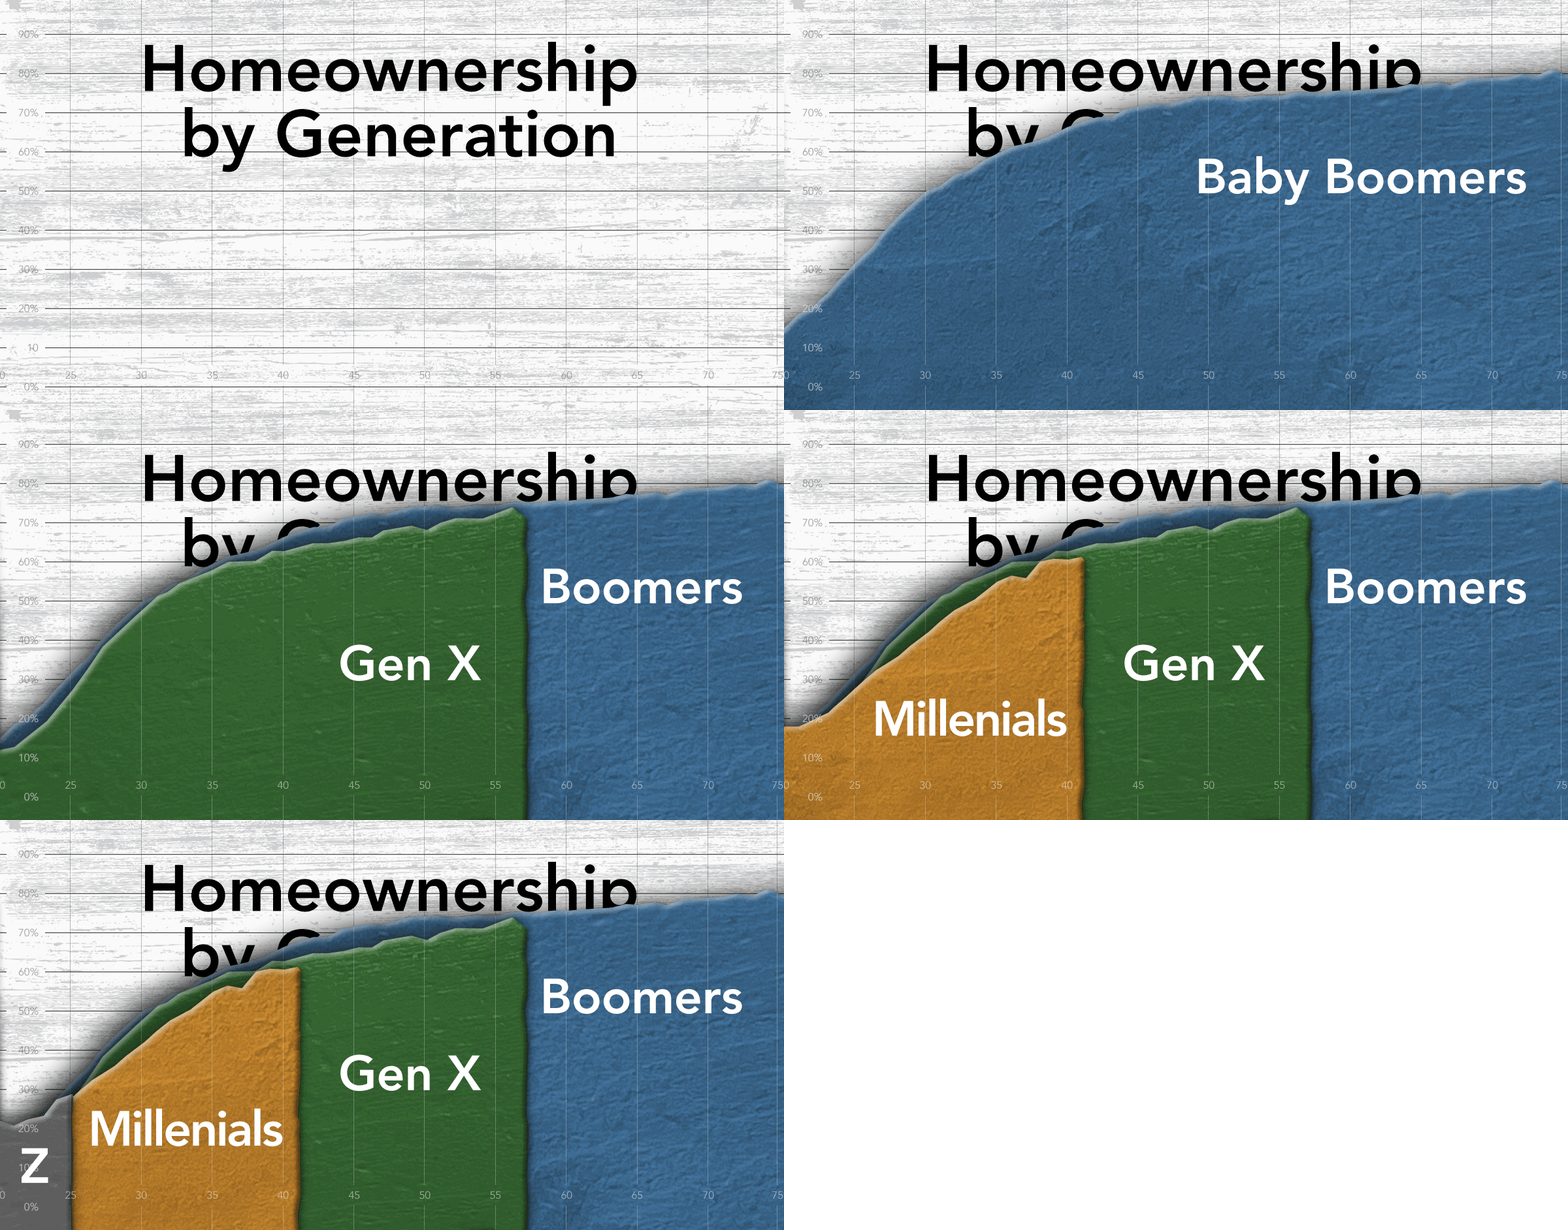
Yes, I am talking about the transition of this society from Baby-Boomers to Millennials. I know that Generation X is in between, but the name alone says it all – we don’t get a real generational name. I’m a Gen-Xer and a housing economist, so I can say this – we are not big enough to drive market conditions like the Boomers or Millennials.
As the reigns of our society are turned over to Millennials, their lifestyle and economic choices will dictate what happens to homeownership in the coming decades. Luckily, all indications are that they still believe in the American Dream and when the time is right, will buy a home. In the meantime, we must be patient and look closely at each new release of the data for any sign that the transition is happening. In other words, this is why housing economists get so excited about March.


