Later this week, the Federal Open Market Committee (FOMC) will convene and likely announce a rate cut, according to experts. The first Fed rate cut since December 2008 will trigger industry and media speculation about mortgage rates declining further. While changes to the federal funds rate don't directly influence mortgage rates, a rate cut will indicate concern about possible economic weakness and that may increase demand for long-term Treasury bonds, which mortgage rates follow closely.
“If the 30-year, fixed-rate mortgage declines just a fraction more, consumer house-buying power would reach its highest level in almost 20 years.”
The consensus among economists is that the 30-year, fixed-rate mortgage will decline from its first quarter 2019 rate of 4.4 percent to an average of 3.9 percent in 2019. Additionally, the expectation of lower rates comes during the longest economic boom in history and a continued healthy labor market, prompting the question: what do low mortgage rates and a still booming economy mean for housing?
Mortgage Rates Below Four Percent Likely in 2019
Fannie Mae forecasts that the 30-year, fixed-rate mortgage will fall from its July 2019 rate of 3.8 percent to 3.7 percent for the remainder of the year, boosting affordability for home buyers.
The First American Real House Price Index (RHPI) adjusts home prices based on changes to consumer house-buying power, how much one can buy based on household income and the 30-year, fixed-rate mortgage. Shifts in income and interest rates either increase or decrease consumer house-buying power or affordability. When incomes rise and/or mortgage rates fall, consumer house-buying power increases.
If the mortgage rate declines from its current July 2019 level of 3.8 percent to the expected level of 3.7 percent in the third quarter of 2019, assuming a 5 percent down payment, and the July 2019 average household income of $65,800, house-buying power increases a modest 0.1 percent, from $410,000 to $414,000. In this hypothetical 3.7 percent mortgage rate environment, consumer-house buying power would be 13.3 percent higher than it was in July 2018, when the 30-year, fixed mortgage rate was 4.5 percent. In fact, it would be the highest house-buying power in the history of the series, which dates to the year 2000.
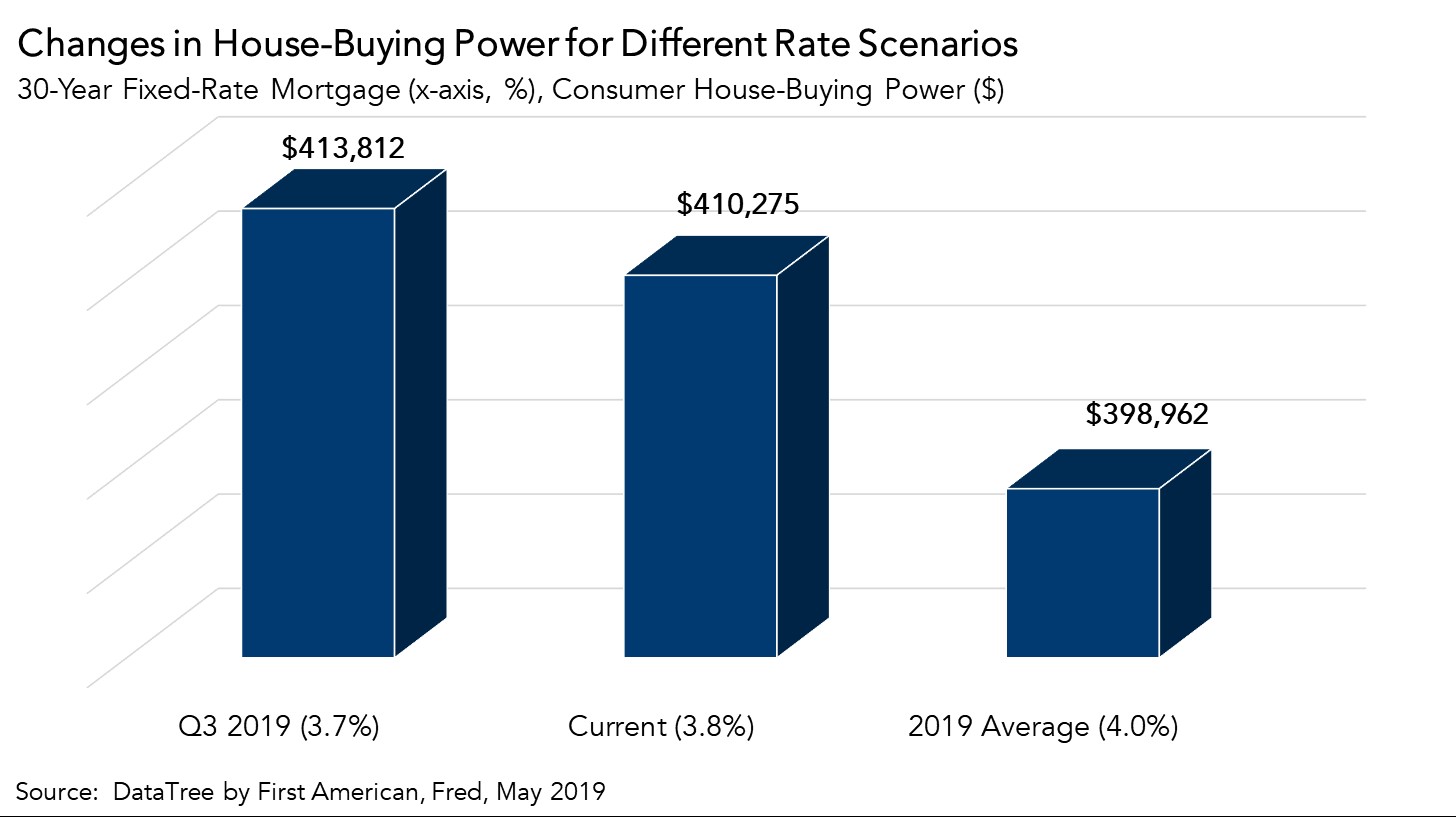
Mortgage Rates and Income Growth Boosting Consumer House-Buying Power
It’s no secret that declining mortgage rates increase affordability. However, mortgage rates have been below 3.7 percent before. Indeed, in 2012, the 30-year, fixed-rate mortgage hit a low of 3.3 percent. Yet, house-buying power was lower than it is today. The reason? The other half of the house-buying power equation: income.
Our estimate of average household income, based on Census and Bureau of Labor Statistics data, is at the highest level since 2000. Average nominal household incomes are nearly 57 percent higher today than in January 2000. Record income levels combined with mortgage rates near historic lows mean consumer house-buying power is more than 150 percent greater today than it was in January 2000. While rates are expected to remain low, the fate of the labor market will determine the direction of the other half of the house-buying power equation and, ultimately, affordability.
For the full analysis of affordability, the top five states and markets with the greatest increases and decreases in real house prices, and more, please visit the Real House Price Index.
The RHPI is updated monthly with new data. Look for the next edition of the RHPI the week of August 26, 2019.
Sources:
May 2019 Real House Price Index Highlights
The First American Real House Price Index (RHPI) showed that in May 2019:
- Real house prices decreased 0.7 percent between April 2019 and May 2019.
- Real house prices declined 3.7 percent between May 2018 and May 2019.
- Consumer house-buying power, how much one can buy based on changes in income and interest rates, increased 1.3 percent between April 2019 and May 2019, and increased 9.3 percent year over year.
- Average household income has increased 2.8 percent since May 2018 and 56.4 percent since January 2000.
- Real house prices are 17.0 percent less expensive than in January 2000.
- While unadjusted house prices are now 3.2 percent above the housing boom peak in 2006, real, house-buying power-adjusted house prices remain 41.1 percent below their 2006 housing boom peak.
May Real House Price State Highlights
- The four states with the greatest year-over-year increase in the RHPI are: Wisconsin (+1.5 percent), Maryland (+0.2 percent), New Hampshire (+0.2 percent), and Rhode Island (+0.1 percent).
- The five states with the greatest year-over-year decrease in the RHPI are: North Dakota (-8.5 percent), Wyoming (-8.0 percent), California (-7.1 percent), Arkansas (-5.8 percent), and New Mexico (-5.7 percent).
May 2019 Real House Price Local Market Highlights
- Among the Core Based Statistical Areas (CBSAs) tracked by First American, the five markets with the greatest year-over-year increase in the RHPI are: Providence, R.I. (+2.2 percent), Milwaukee (+1.1 percent), Columbus, Ohio (+0.7 percent), Detroit (+0.7 percent), and Las Vegas (+0.1 percent).
- Among the Core Based Statistical Areas (CBSAs) tracked by First American, the five markets with the greatest year-over-year decrease in the RHPI are: San Jose, Calif. (-13.9 percent), Seattle (-9.4 percent), San Francisco (-7.8 percent), Portland, Ore. (-7.7 percent), and Riverside, Calif. (-7.0 percent).
About the First American Real House Price Index
The traditional perspective on house prices is fixated on the actual prices and the changes in those prices, which overlooks what matters to potential buyers - their purchasing power, or how much they can afford to buy. First American’s proprietary Real House Price Index (RHPI) adjusts prices for purchasing power by considering how income levels and interest rates influence the amount one can borrow.
The RHPI uses a weighted repeat-sales house price index that measures the price movements of single-family residential properties by time and across geographies, adjusted for the influence of income and interest rate changes on consumer house-buying power. The index is set to equal 100 in January 2000. Changing incomes and interest rates either increase or decrease consumer house-buying power. When incomes rise and mortgage rates fall, consumer house-buying power increases, acting as a deflator of increases in the house price level. For example, if the house price index increases by three percent, but the combination of rising incomes and falling mortgage rates increase consumer buying power over the same period by two percent, then the Real House Price index only increases by 1 percent. The Real House Price Index reflects changes in house prices, but also accounts for changes in consumer house-buying power.
Disclaimer
Opinions, estimates, forecasts and other views contained in this page are those of First American’s Chief Economist, do not necessarily represent the views of First American or its management, should not be construed as indicating First American’s business prospects or expected results, and are subject to change without notice. Although the First American Economics team attempts to provide reliable, useful information, it does not guarantee that the information is accurate, current or suitable for any particular purpose. © 2019 by First American. Information from this page may be used with proper attribution.