Beginning in 2011 and continuing through 2018, the share of rent-burdened households declined nationally – a trend reversal from the decade between 2000 and 2010. According to the Department of Housing and Urban Development, rent-burdened households spend over 30 percent of their income on rent. However, as the old adage goes, it’s all about “location, location, location,” and factors affecting rent burden, such as renter household income and the supply of multi-family housing, vary significantly from city to city. Examining these dynamics by market can tell us where the share of rent-burdened households declined the most between 2010 and 2018.
“As always with real estate – location, location, location. It appears rent burden relief follows the same adage.”
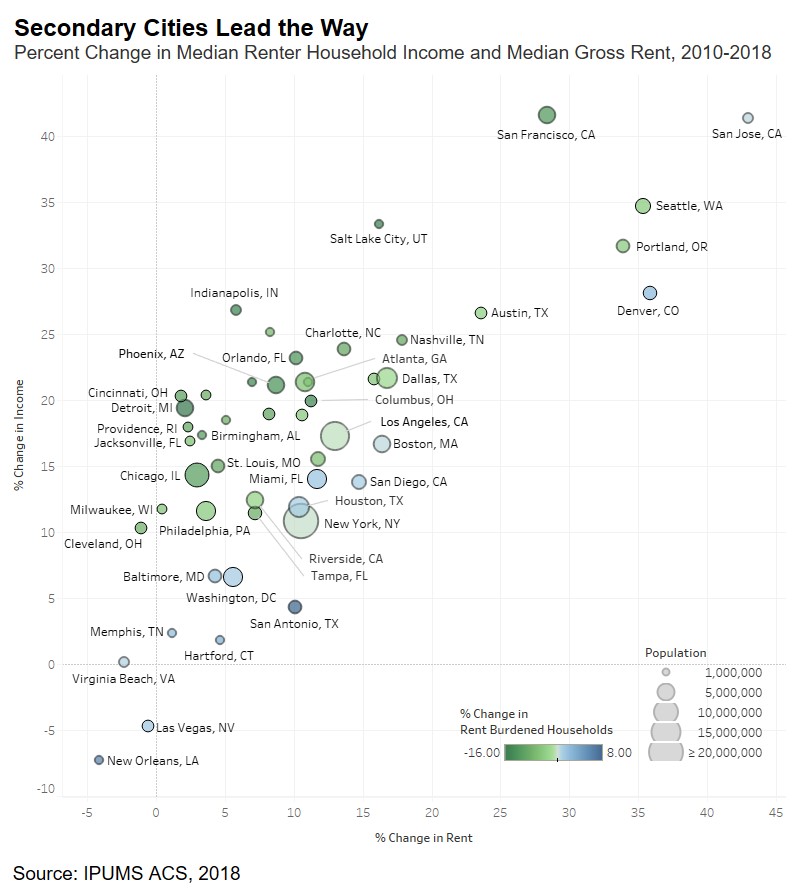
Secondary Cities Lead the Way in Rent-Burden Relief
The share of rent-burdened households declined in 39 of the 50 largest U.S. metropolitan areas from 2010 to 2018. There was little to no change (below 2 percent) in eight cities, and Hartford, Conn., New Orleans and San Antonio were the only cities with an increase in the share of rent-burdened households over that period. The 10 cities with the largest declines in the share of rent-burdened households were:
- Detroit: -16.0 percent
- Salt Lake City: -14.8 percent
- Columbus, Ohio: -14.5 percent
- Indianapolis: -14.4 percent
- Richmond, Va.: -14.1 percent
- Phoenix: -13.0 percent
- Orlando, Fla.: -12.7 percent
- San Francisco: -12.3 percent
- Birmingham, Ala.: -12.0 percent
- Chicago: -11.7 percent
Some common trends emerge when examining the top 10 markets in which the share of rent-burdened households declined the most, including strong wage growth, rising supply of rental properties, and low to moderate rates of rent growth.
Moving In: High-Income Renters
One common trend among many of the markets where the share of rent-burdened households declined the most was an influx of renters. For example, the number of renter households jumped 38 percent in Raleigh, N.C., between 2010 and 2018, or just under 50,000 households. Charlotte, N.C., and Jacksonville, Fla., followed closely behind, with 35 and 30 percent growth in the number of renter households, respectively.
The new renters flooding these markets may be following job growth in high-paying industries. Between 2010 and 2018, employment in professional, scientific and technical services, a Bureau of Labor Statistics sector representing high-wage, highly skilled positions, grew at an average annual rate of 7.5 percent in Austin, 6.2 percent in Nashville, 5.3 percent in Raleigh, 5 percent in Charlotte, and 4.5 percent in Salt Lake City. In comparison, the national growth rate in this sector was only 2.2 percent. The growth in high-wage industries attracts renter households with higher household incomes, contributing to a declining share of rent-burdened households in these markets.
Rental Housing Supply Keeping Pace
An influx of high-income renters, however, is likely to bid up rents, if demand is met with a limited supply of available units. Yet, the supply of rental units increased in many of the markets attracting high-income renters, including Charlotte, Nashville, Salt Lake City, and Dallas, helping reduce the share of rent-burdened households in these markets.
According to the Census Bureau, between 2014 and 2018, Charlotte issued an average of 7,510 permits annually for multi-family units, with Nashville (6,421 units) and Dallas (25,051 units) likewise adding multi-family housing. Housing permits are a leading indicator of housing completions, providing insight into housing market activity in the following months. In all three cities, annual numbers of multi-family permits between 2014 and 2018 beat pre-recession peaks by at least 30 percent. In Salt Lake City, 91 percent of all residential housing permits between 2014 and 2017 were for multi-family construction—an average of 1,478 units permitted per year, nearly three times the annual average permitted between 2000 and 2017. This increase in rental supply helped meet the demand from new high-income renters.
Renter Household Income Outpacing Rent Growth in High-Rent Cities
The share of rent-burdened households declined even in some cities known for their high rents, such as San Francisco, Seattle and Portland, Ore. Despite an increase of 28 percent in median rents, median renter household income in San Francisco increased by nearly 42 percent between 2010 and 2018, resulting in a 12-percentage point decline in the share of rent-burdened households. High-rent markets, such as San Francisco, Seattle and Portland are destinations for millennial net in-migration and offer high-wage employment. These markets are examples of median household incomes simply outpacing fast-growing rents.
Local Dynamics Drive Decline in Rent-Burdened Households
The story behind the decline in the share of rent-burdened households varies due to the unique dynamics of each market. In some markets, as high-income renters have moved in seeking higher paying jobs, multifamily construction has added rental properties to meet the demand. In other markets, where rent is high and growing quickly, household renter income was able to grow even faster. As always with real estate – location, location, location. It appears rent burden relief follows the same adage.
Ksenia Potapov contributed to this blog post.


