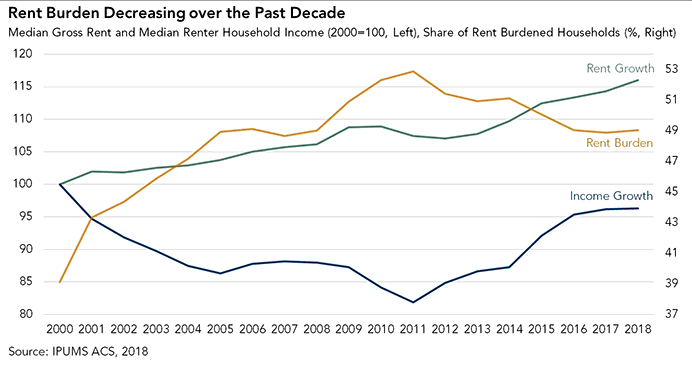
After nearly 20 years of rising rents, renter affordability, or the lack thereof, is a hot topic in housing. The long-running increase in rents has fueled a rise in the share of rent-burdened households, defined by the Department of Housing and Urban Development (HUD) as households that spend over 30 percent of their income on rent.
“In contrast to the decade between 2000 and 2010, rising renter household income, combined with a steady supply of new multi-family homes, has outpaced rent growth in the last decade, causing a modest decline in the share of rent-burdened U.S. households.”
In 2010, over half of all renter households in the U.S. were rent burdened. As housing costs consume a larger share of income, households must often cut back spending in other areas, including food, transportation and health care. In addition, rent-burdened households face greater challenges saving for a down payment if they want to become a homeowner. Yet, since peaking in 2011 at nearly 53 percent, the share of rent-burdened households declined modestly to 49 percent in 2018, the latest available year of data. What dynamics could be driving this decline?
Increasing Renter Household Incomes
One piece of the puzzle is rising renter household income. Between 2010 and 2018, the median renter household income grew nearly 14 percent, from $35,000 to $40,000. This is in stark contrast to the previous decade, when median renter household income fell by 16 percent, largely due to the Great Recession. Declining income contributed significantly to the increased share of rent-burdened households, which surged from 40 to 52 percent between 2000 and 2010. The return of renter household income growth in the last decade has certainly contributed to the modest decline in the share of rent-burdened households. But demand is only half of the equation, supply is the other.
Multi-Family Construction Boom
Between 2010 and 2018, the national median rent increased by 7 percent, from $960 to $1,024 per month in inflation-adjusted dollars, which was half as much as the growth in renter household income over the same period. The relatively subdued amount of rent growth was partly due to multi-family construction, which increased quickly after the end of the recession, surpassing its pre-recession level. A total of 36 million multi-family housing units were started between 2010 and 2018. The average pace of starts has been 370,000 units per month since 2015, which is significantly stronger than the average pace of 294,000 units in the pre-recession era between 1995 and 2007. This sustained level of construction hasn’t occurred since the 1980s.
Rent-Burden Decline
The combination of increased supply suppressing rent growth and rising renter household income triggered a modest decline in the share of rent-burdened households, from a peak of 53 percent in 2011 to 49 percent in 2017. There was a small 0.2 percentage point increase in 2018, as rental income growth slowed.

In contrast to the decade between 2000 and 2010, rising renter household income, combined with a steady supply of new multi-family homes, has outpaced rent growth in the last decade, causing a modest decline in the share of rent-burdened U.S. households. While an improvement, it’s important to note that the share of rent-burdened households remains high at 49 percent, representing nearly 20 million households. Furthermore, the national trend doesn’t necessarily reflect the dynamics in different markets. In an upcoming post, we will break down the national trend to examine what’s happened in different markets. Rental income growth and multi-family supply varies by market, so we expect the rent-burden story to differ by market as well.


