Following two years of red-hot activity accelerated by pandemic-era dynamics, the housing market is cooling as demand falls in response to a significant decline in affordability. Double-digit house-price appreciation chipped away at affordability as the pandemic-driven supply and demand imbalance fueled competition for a limited inventory of homes for sale. Meanwhile, the average 30-year, fixed mortgage rate increased from 3 percent in April 2021 to 5 percent in April 2022. As a result, the median U.S. renter, who can also be considered the median potential first-time home buyer, could afford 35 percent of the homes for sale nationally in April 2022, down from 54 percent a year earlier.
Yet, millennials continue to age into their prime home-buying years, creating a wave of demographic demand for homeownership. Many potential first-time home buyers have pulled back from the market amid the deterioration in affordability, but they can still find pockets of affordable homes.
Five Oases of Affordability for Potential First-Time Home Buyers
For potential first-time home buyers, affordability is a function of their house-buying power and the corresponding share of homes for sale that are within reach. We can determine a first-time buyer’s house-buying power using the median renter’s income, the prevailing 30-year, fixed mortgage rate, and the assumption that one-third of the first-time home buyer’s pre-tax income is used for a mortgage with a 5 percent down payment. The share of homes for sale in any given market that are affordable for the median renter is estimated by comparing data on home sale transactions from First American Data & Analytics to the median renter’s house-buying power.
Rapid nominal house price appreciation combined with rising mortgage rates drove down affordability year over year in all of the top 50 U.S. markets. Not surprisingly, cities where first-time home buyer affordability declined the most over the past year were typically ones where house prices increased most rapidly. These markets include Phoenix, where only 16 percent of homes were affordable to the median renter, Raleigh, N.C. (27 percent), and Providence, R.I. (20 percent).
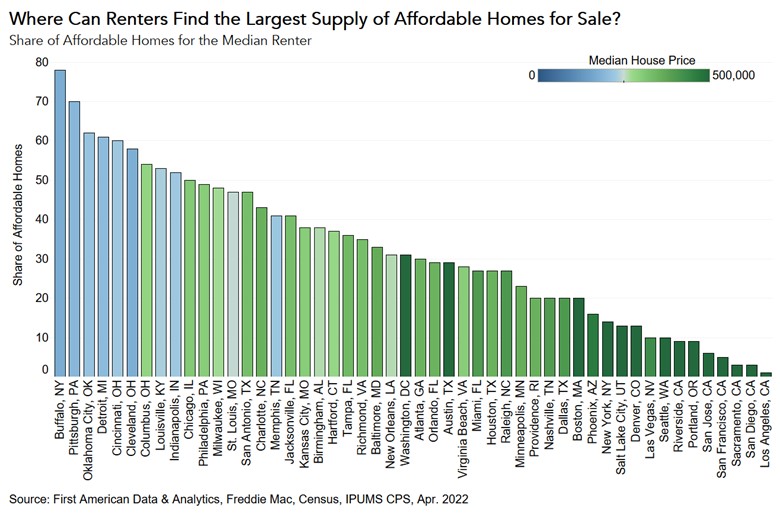
However, despite the broad decline in affordability, potential first-time home buyers can find cities where there are still plenty of affordable homes for sale. For a housing market to be considered affordable, the median renter should be able to afford 50 percent or more of the homes for sale. Several cities met that threshold in April 2022, and some by wide margins. For example, the five cities where the median renter could find the largest supply of affordable homes to buy were:
- Buffalo, N.Y. (78 percent)
- Pittsburgh (70 percent)
- Oklahoma City (62 percent)
- Detroit (61 percent)
- Cincinnati (60 percent)
What’s the Outlook for First-Time Home Buyers?
Since April, mortgage rates have trended even higher, further reducing house-buying power and dampening demand. As the housing market cools, house price growth is likely to moderate as potential buyers pull back from the market, allowing supply and demand to rebalance. But, in the interim, cities such as Buffalo, N.Y., Pittsburgh, Oklahoma City, and Detroit provide renters the greatest opportunity to purchase a home.
Data Sources:
About the First-Time Home Buyer Outlook Report
Housing affordability is often reduced to a comparison of household income to house prices. This overlooks what matters to potential buyers – their house-buying power. First American’s proprietary First-Time Home Buyer Outlook Report examines first-time home buyer affordability by considering the share of homes for sale that are within the renter’s house-buying power. The larger the share of homes for sale that first-time home buyers can afford to buy, the more affordable the market.
First-time home buyer house-buying power is based on the median renter household’s income, the prevailing 30-year, fixed mortgage rate, the most recent year’s property tax rate for the geography of the renter, and assumes a fixed cost for private mortgage insurance, a 5 percent down payment and that one-third of their pre-tax income is used for the mortgage. The share of homes for sale is based on First American Data & Analytics’ aggregation of publicly recorded home sales. The median renter household’s income is derived from the 2021 Annual Social and Economic Supplement (ASEC) of the Current Population Survey, reporting income for the year 2020. It was assumed that household income increased by 4.8 percent annually between 2020 and 2022, based on the average annual percent increase in median renter household income between 2013 and 2017.