Last week, the yield curve inverted, meaning the yield on short-run Treasury bonds exceeded the yield on long-run Treasury bonds, which prompted increased speculation that a recession may be on the horizon. The speculation is rooted in the historical correlation between yield curve inversions and recessions, which have occasionally followed one to two years after a yield curve inversion.
It is important to distinguish between the correlation observed between inverted yield curves and recessions and causation. For example, the correlation between ice cream sales and murders is often used in statistics classrooms to underscore the point that correlation is not causation. At times, there may have been underlying economic events or conditions that resulted in both a yield-curve inversion and a recession, but it’s more difficult to know if that’s the case now.
How Has Housing Market Fared Amid Rising Rates and Recessions?
Forecasting that a recession will happen over a specific near-term horizon is highly uncertain. What is much more certain is that mortgage rates will likely continue to rise. We really don’t know if a recession may be one to two years off, but we can analyze how housing markets have behaved during recessions and rising mortgage rate environments.
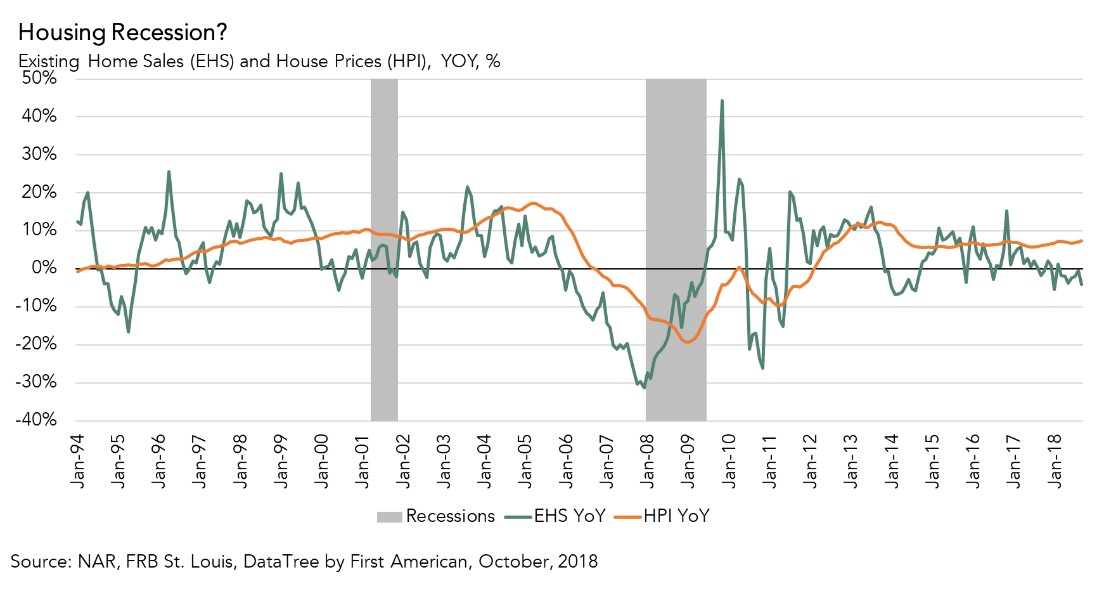
The chart below shows how home prices and existing-home sales behaved over the last two recessions. House prices clearly declined significantly during the Great Recession, but in the early-2000s recession, house price appreciation hardly skipped a beat and year-over-year existing-home sales growth barely declined. The reality is home prices and existing-home sales don’t necessarily decline, just because of a recession. In fact, the housing market actually benefits in one specific way during a recession – monetary policy is usually eased often leading to falling mortgage rates, which increases consumer house-buying power and makes homes more affordable.
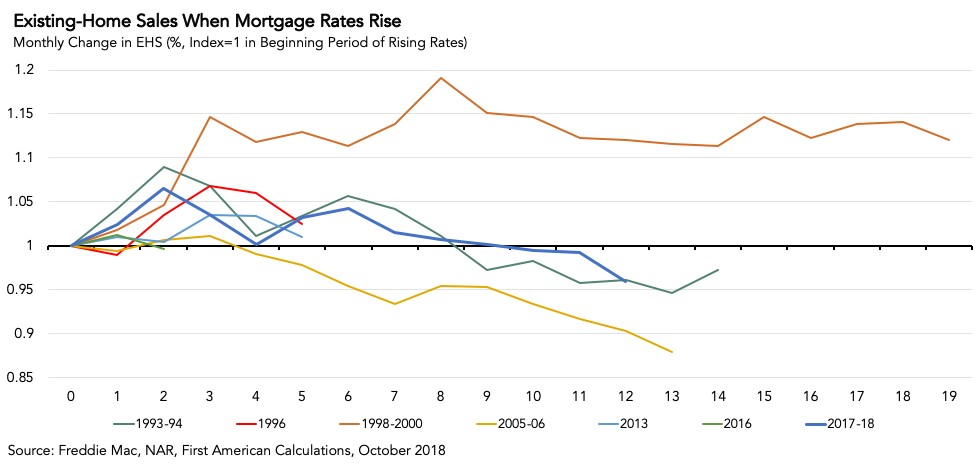
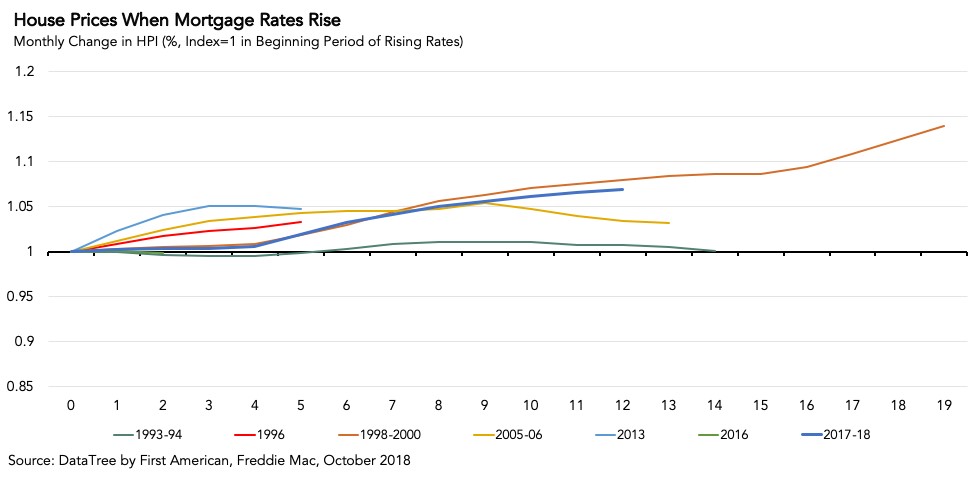
What about market responses to rising mortgage rate environments, like the one we have seen in the past year? Over the last 25 years, there have been seven significant rising-rate eras. The next two charts show how existing-home sales and house prices have responded to each event.
Home prices seem even more resistant to rising mortgage rates. Apart from the 1993-94 rising-rate period, when house prices declined ever-so slightly and briefly, house prices have always continued to rise, albeit more slowly, when rates have increased.
Housing Market Often Resilient to Rising Rates and Recessions
So, what is the takeaway? The housing market is complex and dynamic, and it responds to a variety of demographic, economic and monetary conditions.
Every recession and rising-rate event is different, each driven by a different set of events and conditions. It’s safe to say that the events that may cause the next recession will not be the same as those that caused the Great Recession and the housing bust. While we don’t know what may lead to a recession at some point, history shows us that the housing market can still perform well amid rising mortgage rates and a recession.


