As the home-buying season continues, the inventory of homes for sale remains historically low, while demand is increasing. Not surprisingly, house prices continue to rise. In March, unadjusted house prices increased by 6.4 percent compared with a year ago and they are now 8.7 percent above the housing boom peak for unadjusted house prices reached in 2007. But, does that tell the real story?
“Even though unadjusted house prices are higher today than ever before, consumer house-buying power remains strong, so real house prices aren’t even close to their historical peak.”
While unadjusted house prices have been on the rise since the end of 2011, nearly a seven-year run, consumer house-buying power has also increased by 14.3 percent over the same period. House-buying power, how much one can buy based on changes in income and interest rates, has benefited from a decline in mortgage rates since 2011, and the more recent slow, but steady growth of household income. Between the peak of unadjusted house prices in 2011 and today, the 30-year, fixed-rate mortgage has fallen from 5.0 percent to 4.4 percent in March. Over the same period, household income has increased 19 percent. Lower mortgage rates and higher income levels means significantly higher house-buying power today than at the end of 2011.
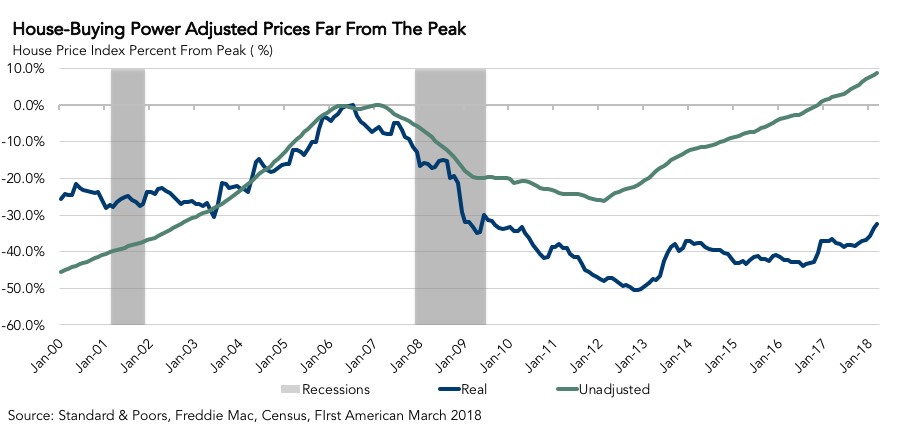
When house prices are adjusted for consumer house-buying power, the real level of house prices becomes more apparent. Consumer house-buying power-adjusted house prices dropped just over 50 percent from the peak in July 2007 to the trough reached at the end of 2012. Real house prices have since increased, but today remain 32.5 percent below the 2007 peak and 9.2 percent below their level in the year 2000. Even though unadjusted house prices are higher today than ever before, consumer house-buying power remains strong, so real house prices aren’t even close to their historical peak.
For Mark’s full analysis on affordability, the top five states and markets with the greatest increases and decreases in real house prices, and more, please visit the Real House Price Index.
The RHPI is updated monthly with new data. Look for the next edition of the RHPI the week of June 18, 2018.


