Yesterday, the Bureau of Labor Statistics released the employment situation report for April. Here are the highlights. Total non-farm payroll jobs increased by 164,000 in April. In fact, total non-farm payroll jobs have now increased every month since October 2010. Since that date, the U.S. economy has added more than 17.5 million jobs. The unemployment rate edged down to 3.9 percent, a 17-year low, in April and average hourly earnings are up 2.6 percent over a year ago for production and non-supervisory employees. So, why would an uptick in wages matter to a housing economist? Read on.
“As economic conditions remain strong and the labor force continues to tighten, it’s reasonable to expect wages to rise faster, which translates to higher household income and house-buying power – and that’s why wage growth matters to a housing economist.”
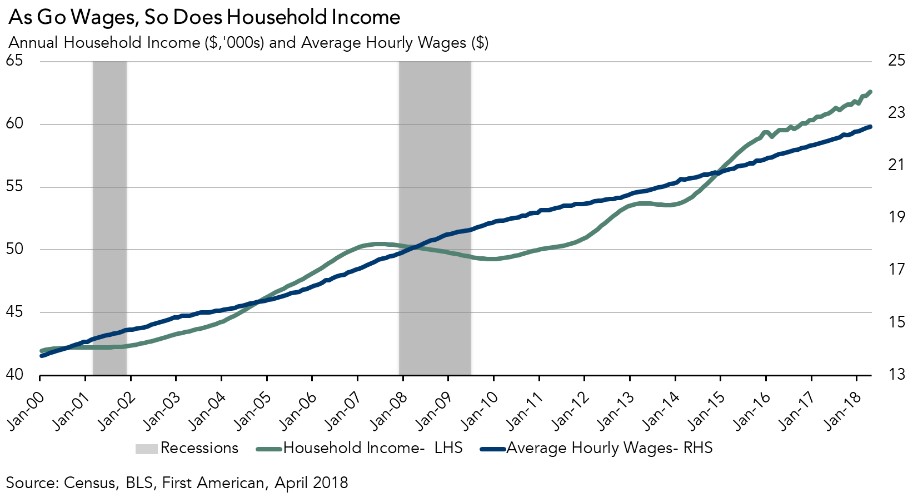
Recently, I noted that wage growth often leads to rising household income levels, which increases consumer house-buying power. It’s pretty simple. Faster rising wages increases the pace of household income growth and improves consumer house-buying power. This month’s 2.6 percent rise in wages implies a 3.0 percent increase in average household income over a year ago. Based on April’s reported average hourly wages and our estimate of average annual income, along with the average 30-year, fixed-rate mortgage rate in April, we estimate that the typical first-time home buyer with a five percent down payment has the house-buying power to afford a $358,840 home. That’s an increase of more than $100,000 since the end of the last recession.
What is the Future of Wage Growth?
In order to forecast inflation and wage growth, economists have historically used the Phillips curve, which shows that as the unemployment rate goes down, wage growth goes up. Yet, today, it seems that the Phillips curve relationship is broken. We have a low – arguably very low – unemployment rate, but not nearly the level of production and non-supervisory employee wage growth that would be expected, 4.0 percent, according to the Phillips curve.
A stronger indicator in today’s economy of likely wage growth may be the prime-age labor force participation rate, which is the total number of employed and unemployed 25-54 year-olds as a share of the total number of 25-54 year-olds. As this participation rate rises, competition for workers increases and leads to higher wages. The prime-age labor force participation rate hit a post-recession low in September 2015. Since then, it has been rising steadily to its current level of 82.0 percent and is much closer to its pre-recession level of 83.0 percent.
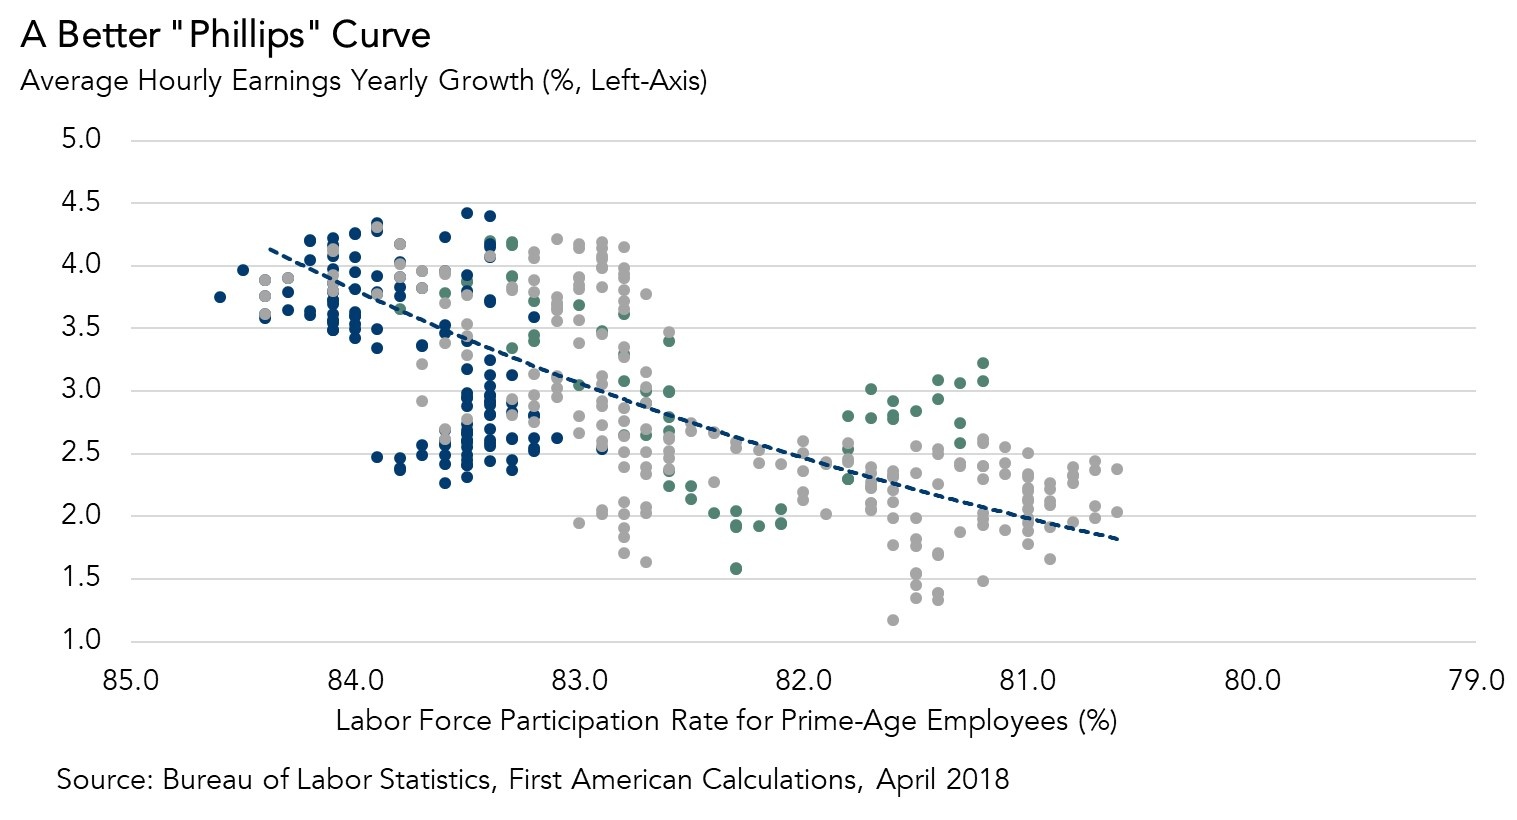
The current prime-age labor force participation rate, our alternative for the “Phillips curve,” indicates production and non-supervisory wage growth should be 2.56 percent. This is much closer to today’s reported growth rate of 2.60 percent. As economic conditions remain strong and the labor force continues to tighten, it’s reasonable to expect wages to rise faster, which translates to higher household income and house-buying power – and that’s why wage growth matters to a housing economist.


