That nominal house prices are growing faster than household incomes is often used as the basis for arguing that we are facing an affordability crisis. It is true that unadjusted house prices grew faster than income between November 2016 and November 2017. Our Real House Price Index (RHPI) showed that unadjusted house prices increased by 6.0 percent in November on a year-over-year basis and are 6.3 percent above the housing boom peak in 2007. Over the same 12-month period, household incomes have increased by significantly less, 2.8 percent.
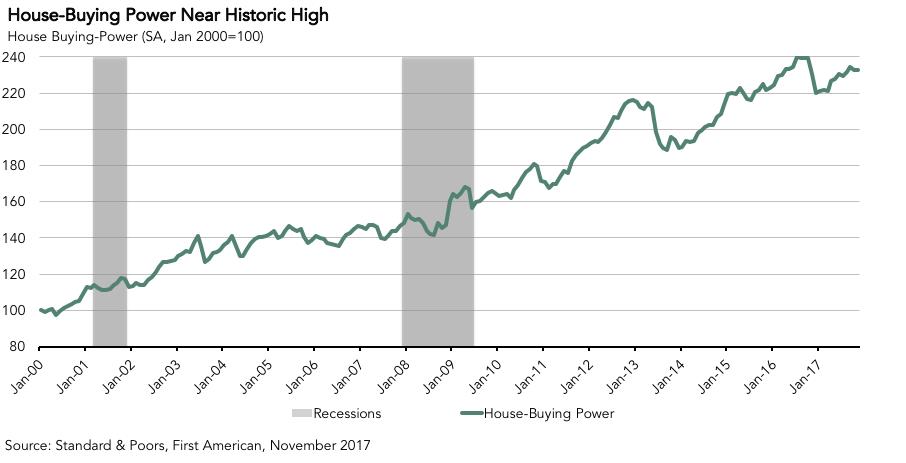
Yet, overlooked in the comparison of income growth and unadjusted house price growth is that a change in household income is not the only factor that influences how much home one can afford to buy. A consumer’s house-buying power, how much one can afford to buy, is also based on changes in mortgage interest rates. Even if one’s income doesn’t change, but interest rates go down, house-buying power increases. Consumer house-buying power, based on changes in income and interest rates, was unchanged between October and November and actually improved by 1 percent, compared with a year ago.
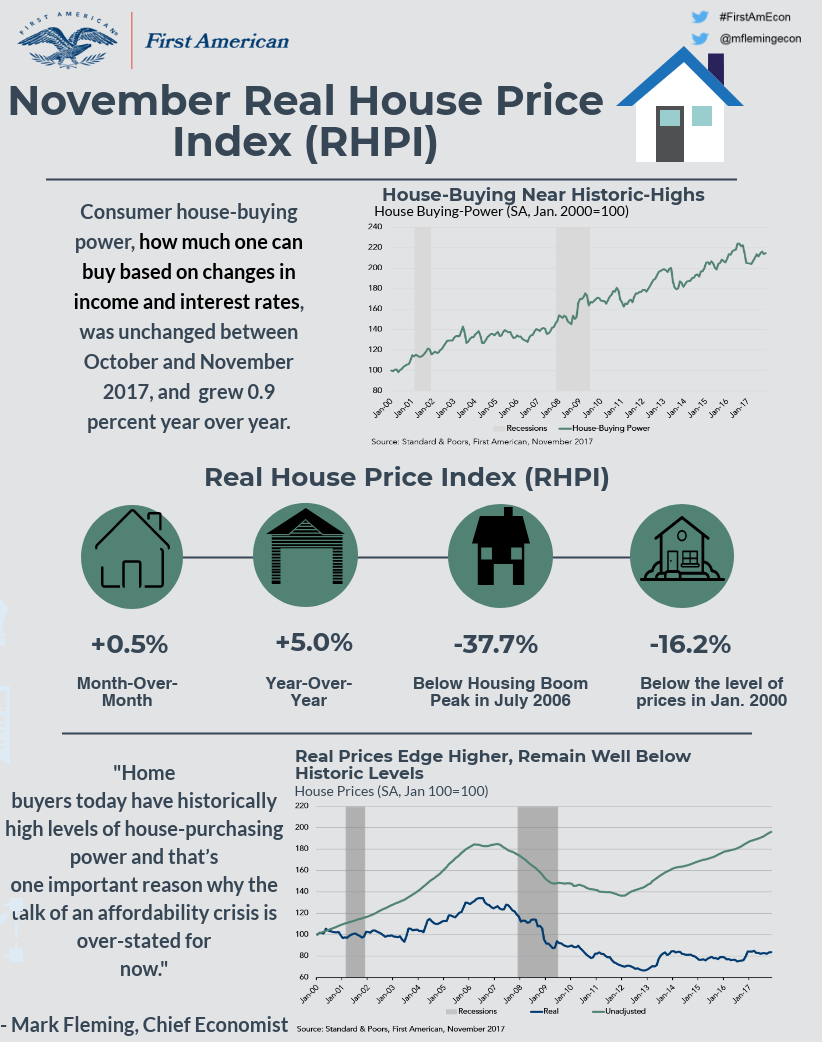
“Home buyers today have historically high levels of house-purchasing power and that’s one important reason why the talk of an affordability crisis is over-stated for now.”
In fact, consumer house-buying power is 2.3 times higher than it was in 2000, almost two decades ago. It’s also only 2.9 percent below the peak in July 2016. Because the long-run trend in mortgage interest rates has been downward, from a peak of 18 percent in 1981, the housing market has benefited from consistently increasing house-buying power. Home buyers today have historically high levels of house-purchasing power and that’s one important reason why, even as unadjusted house price growth exceeds household income growth, the talk of an affordability crisis is over-stated for now.

The First American Real House Price Index (RHPI) showed that in November 2017:
- Real house prices increased 0.5 percent between October and November 2017.
- Real house prices increased 5.0 percent year over year.
- Consumer house-buying power, how much one can buy based on changes in income and interest rates, was unchanged between October and November 2017, and grew 0.9 percent year over year.
- Real house prices are 37.7 percent below their housing boom peak in July 2006 and 16.2 percent below the level of prices in January 2000.
- Unadjusted house prices increased by 6.0 percent in November on a year-over-year basis and are 6.3 percent above the housing boom peak in 2007.
November 2017 Real House Price State Highlights
- The five states with the greatest year-over-year increase in the RHPI are: Delaware (+12.4 percent), Nevada (+10.7 percent), Missouri (+10.6 percent), New York (+8.6 percent) and Washington (+8.3 percent).
- The five states with the smallest year-over-year increase in the RHPI are: Arkansas (-2.9 percent), Maryland (-1.5 percent), Washington, D.C. (-0.5 percent), Alabama (+0.5 percent) and Oklahoma (+1.3 percent).
November 2017 Real House Price Local Market Highlights
- Among the Core Based Statistical Areas (CBSAs) tracked by First American, the five markets with the greatest year-over-year increase in the RHPI are: San Jose, Calif. (+14.0 percent), Las Vegas (+13.6 percent), Seattle (+10.7 percent), Columbus, Ohio (+10.2 percent) and Jacksonville, Fla. (+10.1 percent).
- Among the CBSAs tracked by First American, the five markets with the smallest year-over-year increase in the RHPI are: Pittsburgh (-2.5 percent), Austin, Texas (+1.3 percent), Riverside, Calif. (+1.5 percent), Memphis, Tenn. (+2.6 percent) and Cincinnati. (+2.8 percent).

Next Release
The next release of the First American Real House Price Index will take place on the week of February 26, 2018.
About the First American Real House Price Index
The traditional perspective on house prices is fixated on the actual prices and the changes in those prices, which overlooks what matters to potential buyers - their purchasing power, or how much they can afford to buy. First American’s proprietary Real House Price Index (RHPI) adjusts prices for purchasing power by considering how income levels and interest rates influence the amount one can borrow.
The RHPI uses a weighted repeat-sales house price index that measures the price movements of single-family residential properties by time and across geographies, adjusted for the influence of income and interest rate changes on consumer house-buying power. The index is set to equal 100 in January 2000. Changing incomes and interest rates either increase or decrease consumer house-buying power. When incomes rise and mortgage rates fall, consumer house-buying power increases, acting as a deflator of increases in the house price level. For example, if the house price index increases by three percent, but the combination of rising incomes and falling mortgage rates increase consumer buying power over the same period by two percent, then the Real House Price index only increases by 1 percent. The Real House Price Index reflects changes in house prices, but also accounts for changes in consumer house-buying power.
Disclaimer
Opinions, estimates, forecasts and other views contained in this page are those of First American’s Chief Economist, do not necessarily represent the views of First American or its management, should not be construed as indicating First American’s business prospects or expected results, and are subject to change without notice. Although the First American Economics team attempts to provide reliable, useful information, it does not guarantee that the information is accurate, current or suitable for any particular purpose. © 2018 by First American. Information from this page may be used with proper attribution.


