The Real House Price Index (RHPI) views house prices in relation to consumer house-buying power, incorporating household income, mortgage rates, and an unadjusted house price index. When incomes rise, consumer house-buying power increases. When mortgage rates or house prices rise, consumer house-buying power declines.
In April 2018, increases in all three of these areas drove an 8.8 percent increase in the Real House Price Index from its year-earlier level, marking a significant decline in affordability. Mortgage rates rose by 6.6 percent, while the unadjusted house price index increased by 10.4 percent. Household income, which contributes positively to housing affordability, however, increased 2.9 percent compared with a year ago in April.
“Though unadjusted house prices have risen to record highs, consumer house-buying power stands at near-historic levels, as well, signaling that real house prices aren’t even close to their historical peak,” says Chief Economist Mark Fleming.
It is not surprising that unadjusted house prices have increased so much. Demand for residential real estate, along with a nationwide shortage of supply, has led to a historically tight inventory of homes for sale, which leads to quickly rising house prices. However, trends show that the increase in consumer house-buying power has outpaced the rise in unadjusted house prices.
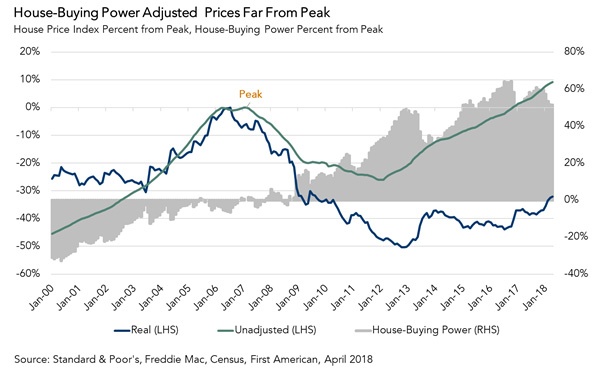
When house prices are adjusted for consumer house-buying power, the real level of house prices becomes more apparent. Real, consumer house-buying power adjusted house prices today are 32.1 percent below their peak in July 2006, and 8.9 percent below their level in the year 2000.
Unadjusted house prices are 9.2 percent above the housing boom peak in 2007, and have been on the rise since the end of 2011, nearly a seven-year run. But consumer house-buying power has increased by more than five times as much - 51 percent - since the housing boom peak in 2007 and is up 16 percent since the end of 2011.
House-buying power, how much one can buy based on changes in income and interest rates, has benefited in recent years from a decline in mortgage rates and the more recent slow, but steady, growth of household income. Between the peak of unadjusted house prices in 2007 and this April, the 30-year, fixed-rate mortgage has fallen from 6.29 percent to 4.47 percent. Over the same period, household income has increased 23.7 percent. Lower mortgage rates and higher income levels mean consumers have significantly higher house-buying power today than they did in 2007.
For Mark’s full analysis on affordability, the top five states and markets with the greatest increases and decreases in real house prices, and more, please visit the Real House Price Index.
The RHPI is updated monthly with new data. Look for the next edition of the RHPI the week of July 16, 2018.


