When you purchase an apartment building as an investment, you’re generally planning to profit through the rent it generates and through price growth of the building over time. When prices are falling, as they are today, investors are less able to reliably predict where prices will end up during an investment’s lifetime. To offset this increased uncertainty, buyers seek to purchase buildings with higher income yields, or capitalization (“cap”) [1] rates. In effect, this transfers a portion of the total return of the property from the future (price appreciation tomorrow) to the present (cash flow today).
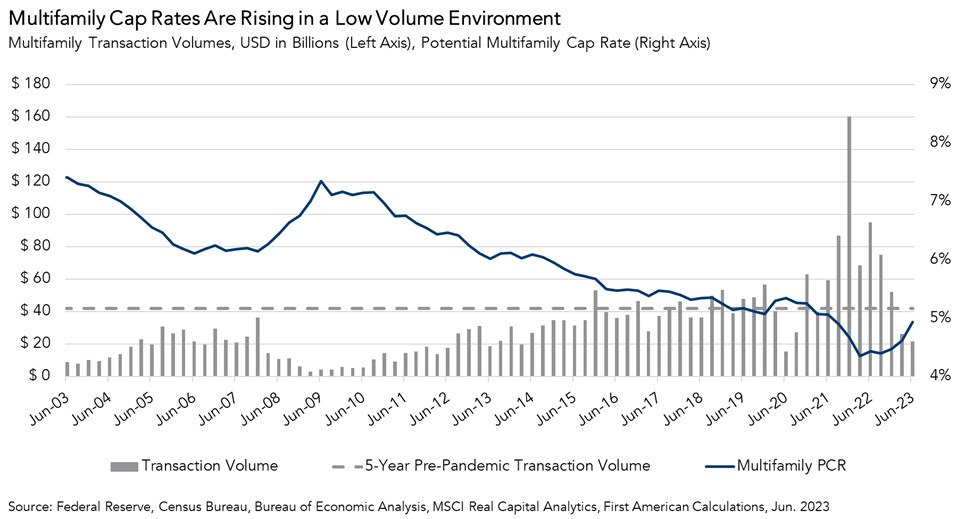
Today, demand to purchase multifamily properties, as measured by transaction volume, has slowed, and sellers are lowering prices to attract prospective buyers, which is driving multifamily cap rates higher.
A Dollar Today or a Dollar Tomorrow
To better understand the determinants of multifamily cap rates, we built First American’s Multifamily Potential Cap Rate (PCR) model, which estimates a national potential multifamily cap rate based on underlying multifamily market fundamentals, including multifamily transaction volume, multifamily debt flows, and renter household formation. In the second quarter of 2023, the multifamily PCR increased to 4.9 percent from 4.6 percent in the first quarter.
“With access to credit tight and low-risk investment alternatives plentiful, demand to purchase multifamily properties will remain suppressed until prices adjust to entice buyers with a higher yield. As a result, upward pressure on cap rates appears to be here to stay for the foreseeable future.”
The quarterly increase in the multifamily PCR was driven in part by a decline in multifamily transaction volume, which is a sign of falling demand to own multifamily properties. Sagging demand to buy apartment buildings puts upward pressure on cap rates by forcing sellers to lower listing prices. While many buyers are still waiting on the sidelines for further price declines, those that are in the market now are looking for deals that provide more cash flow.
My BATNA? A 5 Percent Treasury Bond
Investors’ willingness to wait on the sidelines if favorable purchase prices can’t be found is giving buyers the upper hand in today’s market. In negotiation strategy, the concept of a “Best Alternative to a Negotiated Agreement” (or BATNA) describes one party’s second-best option if a deal isn’t made.
Today, buyers who sit and wait for prices to fall have a relatively low-risk alternative with yields similar to prevailing cap rates: U.S. Treasury Securities.
Having a high-yield, relatively low-risk alternative investment, or BATNA, provides meaningful leverage to a prospective buyer in price negotiations for a commercial property. After all, if the buyer can’t get the price they want, they can withdraw from the commercial real estate market and get paid 5 percent with a short-term Treasury bond to wait on the sidelines until prices fall to their liking. Compared with a year ago, today’s higher yielding Treasury securities gives prospective buyers the ability to wait to deploy their capital until property prices come down, while collecting interest income in the interim.
The availability of lower-risk alternatives isn’t the only dynamic suppressing the demand to purchase apartment buildings. It’s fairly difficult to get a loan right now, and loans that are available are costlier than a year ago. With access to credit tight and low-risk investment alternatives plentiful, demand to purchase multifamily properties will remain suppressed until prices adjust to entice buyers with a higher yield. As a result, upward pressure on cap rates appears to be here to stay for the foreseeable future.
[1] A cap rate is a measure of property’s income yield, regardless of how the owner of that property financed it. More specifically, a cap rate is equal to a building’s net operating income (NOI) divided by the building’s price. NOI is income after covering all operating expenses but before paying debt service, divided by the building’s price.
Second Quarter 2023 Multifamily Potential Cap Rate (PCR) Model
- The multifamily PCR was 4.9 percent, an increase of 0.3 percentage points as compared with the first quarter of 2023.
- The multifamily PCR increased by 0.5 percentage points as compared with one year ago.
Multifamily Cap Rate Outlook Gap
- The gap between the actual multifamily cap rate and the multifamily PCR provides insight into the likelihood of shifts in the actual cap rate. If the multifamily PCR is below the actual multifamily cap rate, it indicates that fundamentals supported lower cap rates than were observed. If the multifamily PCR is above the actual multifamily cap rate, it indicates that fundamentals supported higher cap rates than were observed.
- In the second quarter of 2023, the actual national multifamily cap rate was 3 percentage points higher than the potential multifamily cap rate, indicating that market fundamentals supported a lower cap rate than was observed in the second quarter. Both the actual and potential multifamily cap rate, however, are increasing.
Second Quarter 2023 All-Asset PCR Model
First American’s All-Asset PCR Model estimates a potential national cap rate for all asset classes based on several CRE market fundamentals, including rental income, prevailing occupancy rates, interest rates, the amount of commercial mortgage debt in the economy, and recent property price trends.
- The all-asset PCR was 6.0 percent in the second quarter of 2023, an increase of 0.5 percentage points as compared with the first quarter of 2023.
- The all-asset PCR increased by 1.5 percentage points as compared with the second quarter of 2022.
- In the second quarter of 2023, the all-asset PCR was 1.7 percentage points above its 20-year low of 4.3 percent, which occurred in the in the first quarter of 2022, and 2.9 percentage points below its third quarter 2001 peak of 8.9 percent.
All-Asset PCR Model Outlook Gap
- The all-asset actual cap rate was 1 percentage points higher than the potential cap rate, which suggests that market fundamentals in the second quarter supported slightly lower cap rates than were observed.
- The gap between the actual all-asset cap rate and the potential all-asset cap rate remained the same in absolute terms, but switched from negative to positive. That is, the PCR was 0.1 percentage points below the national all-asset actual cap rate in the first quarter of 2023, and in the second quarter of 2023 the PCR was 0.1 percentage points above the national all-asset cap rate. This signals that market fundamentals support slightly higher cap rates than were observed.
About the Multifamily Potential Cap Rate Model
The multifamily Potential Cap Rate (PCR) Model estimates cap rates based on the historical relationship between multifamily transaction volume, annual changes in renter household formation, and multifamily mortgage flows. The multifamily PCR Model uses these metrics to establish a potential cap rate level that is supported by these market fundamentals. When actual multifamily cap rates are significantly above the multifamily PCR, it indicates that market fundamentals supported lower cap rates than were observed. Conversely, when actual cap rates are significantly below the potential cap rate level, market fundamentals supported higher cap rates than were observed. Multifamily cap rates are aggregated nationally, and the PCR Model is updated quarterly.
A cap rate is a measure of estimated yield, or the return, on an investment property assuming no debt is used to purchase it. Cap rates are calculated by dividing an asset’s net operating income (NOI) by its value. NOI is an asset owner’s remaining income after covering operating expenses, but before servicing debt. Since cap rates do not take debt service into consideration, cap rates are a measure of what is called unlevered yield.