
Key Points:
- Cap rates have risen sharply since the ultra-low-rate pandemic period but remain low relative to long-run historical norms.
- Cap rate spreads over Treasury yields are historically narrow, limiting the room for cap rates to fall without another catalyst.
- A meaningful dip in cap rates would likely require lower interest rates, stronger income-growth expectations, or a structurally lower CRE risk premium, all of which seem unlikely in the near future.
First American’s Potential Cap Rate (PCR) Model showed a modest increase in the all-asset PCR in the first quarter of 2026. At the same time, capitalization (“cap”)[1] rates have increased meaningfully from their pandemic-era lows since the interest rate shock of 2022. In the fourth quarter of 2021, when interest rates were at historic lows, the average cap rate across all-asset classes was approximately 5.2 percent. By the first quarter of 2026, it had climbed to 6.3 percent.
Yet higher does not necessarily mean high. Although the increase in cap rates over the last four years has been painful for many investors, current levels remain low by historical standards. As cap rates for certain asset classes stabilize, investors should not expect a repeat of the last two real estate cycles – from 2001 to 2008 and from 2009 to 2021—when cap rates broadly declined across nearly all property types.
“Cap rates around 6.5 percent may feel high through the lens of recent experience. The fact is relative to long-run history, they remain relatively modest.”
Prop-ortunity Cost
Before 2017, cap rates hadn’t been below 6 percent since before Harry Truman was President of the U.S. In other words, the sub-6 percent cap rates that became common in the late 2010s and early 2020s were the exception, not the historical norm. As the following chart shows, the spread between commercial cap rates and the 10-Year Treasury yield also remains historically low.
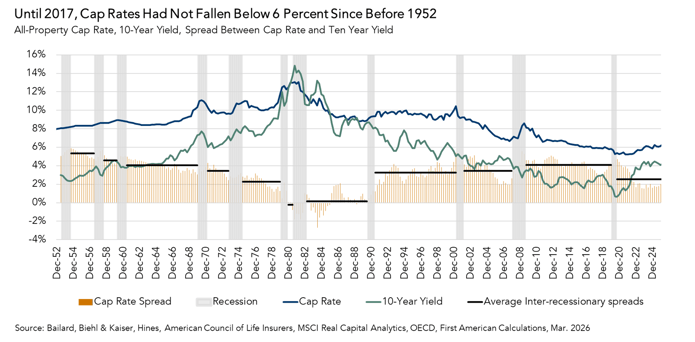
When investors can earn similar yields on lower-risk assets, they typically demand higher returns to invest in riskier, less liquid assets like commercial real estate. A 6.3 percent cap rate may feel elevated relative to recent memory but, with the 10-year Treasury yield currently around 4.4 percent, the less than 2 percentage point spread between them is historically low by long-run standards.
Interest rates are not the sole driver of cap rate movements, but they do establish the “risk-free” opportunity cost that commercial real estate investors use when evaluating commercial real estate opportunities. If the 10-year Treasury yield remains elevated, a meaningful dip in cap rates would likely require one of two things: investors accepting historically narrow spreads, or stronger expected income growth to justify lower acquisition cap rates. Of course, aggressive rent-growth assumptions were one of the defining mistakes behind many distressed 2021 to 2022 vintage investments. Higher interest rates, in other words, have likely raised the floor for cap rates, even if broader CRE fundamentals have limited additional upward pressure so far.
Not High, Just Higher
For cap rates to decline meaningfully from current levels, Treasury yields would likely need to fall, income-growth expectations would need to strengthen, or investors could conclude that commercial real estate risk premiums should remain structurally lower than historical norms. Until then, cap rates around 6.5 percent may not be as high as they feel when viewed through the lens of recent experience. The fact is relative to long-run history they remain relatively modest.
First Quarter 2026 Potential Cap Rate Model
- The all-asset PCR was 5.8 percent, an increase of 0.1 percentage points as compared with the fourth quarter of 2025.
- The all-asset PCR was unchanged compared with one year ago.
All-Asset Cap Rate Outlook Gap
- The all-asset actual cap rate was 0.6 percentage points higher than the PCR, which suggests that market fundamentals in the first quarter supported lower actual cap rates than were observed.
- The gap between the actual all-asset cap rate and the all-asset PCR expanded in the first quarter, increasing from 0.4 percent in the fourth quarter of 2025.
About the Potential Cap Rate Model
The Potential Cap Rate (PCR) Model estimates cap rates based on the historical relationship between interest rates, rental income, prevailing occupancy rates, the amount of commercial mortgage debt in the economy, and recent property price trends. The PCR Model uses these metrics to establish a potential cap rate level that is supported by market fundamentals.
If the PCR is below observed cap rates, it suggests that fundamentals supported lower cap rates than were observed. Similarly, if the PCR is above the actual cap rate, it indicates that fundamentals supported higher cap rates than were observed. Potential cap rates are aggregated nationally and include all major asset classes: multifamily, retail, industrial, office and lodging. The PCR Model is updated quarterly.
[1]: A cap rate is a measure of estimated yield, or the return, on an investment property assuming no debt is used to purchase it. Cap rates are calculated by dividing an asset’s net operating income (NOI) by its value. NOI is an asset owner’s remaining income after covering operating expenses, but before servicing debt. Since cap rates do not take debt service into consideration, cap rates are a measure of what is called unlevered yield.


