Last week, I helped present the results from the American Enterprise Institute (AEI)/First American National Housing Market Index, one of the most comprehensive analyses of the U.S. housing market. The results provide insight into the 2017 spring home buying market and shed light on housing’s $1 trillion question.
Fourth Quarter 2016 National Housing Market Index
For the fourth quarter of 2016, First American and AEI's International Center on Housing Risk (ICHR) updated the proprietary National Housing Market Index (NHMI). The NHMI measures virtually the entire housing market, including financed home sale transactions, cash sales, and the market share for owner- and non-owner-occupied transactions, dollar volumes, loan counts and average loan amounts. It combines ICHR’s data on the federal agency market, which includes data from the Government-Sponsored Enterprises (GSEs), Fannie Mae and Freddie Mac, and data from the Federal Housing Association (FHA), Veterans Affairs (VA), and Rural Housing Services (RHS) with data provided by First American via DataTree.com to create a combined data set with nearly complete coverage of the entire market at the national, state and metro levels.
Will Total Home Sales Exceed $1 Trillion in 2017?
“The total value of residential purchase transactions in the U.S. housing market approached $1 trillion in 2016. The share of cash sales continues to decrease, but remains a significant portion of the overall market at 28 percent,” said Mark Fleming, chief economist at First American. “Entering the busy spring home buying season, I expect prices to continue to rise and transaction volumes to continue to grow, spurred on by the strong sellers’ market and increasing Millennial, first-time homebuyer demand.”
The National Housing Market Index shows that:
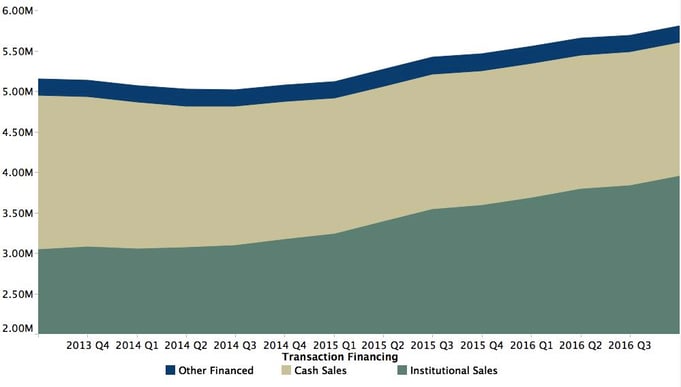
- Over the four quarters ending in the fourth quarter of 2016, 5.8 million sales transactions were reported, which is up 350,000 transactions (6.4 percent) from the fourth quarter of 2015.
- Transactions with institutional-supported (GSE, FHA, RHS, VA) mortgages accounted for 3.95 million sales (68 percent of all sales transactions).
- Cash sales accounted for an additional 1.65 million sales transactions.
- The cash sale share continued to trend down, accounting for 28 percent of all transactions in 2016, down from 30 percent in 2015 and 36 percent in 2013.
- The total amount of purchase originations over the four quarters ending in the fourth quarter of 2016 was $987 billion.
- Texas, California and Florida accounted for $300 billion (31 percent).
- California accounted for $1 out of every $7 of purchase originations.
- The full audio recording of the AEI/First American NHMI briefing can be found here.
Figure 1: Annualized Home Sales by Transaction Financing
Chief Economist Analysis Highlights
- Almost all states show increased home sales since the end of 2012, with a few notable exceptions, including Maine, Wyoming, and North Dakota. The markets with the greatest increase in home sales include New Jersey, North Carolina, Maryland, and Oregon.
- The five most improved markets compared with the fourth quarter of 2012 are Portland, Ore.; Charlotte, N.C.; Baltimore; Atlanta; and Tampa, Fla. In each of these markets, home sale transaction volumes have increased by more than 25 percent since 2012.
- Owner-occupied home sales are increasing the most outside the top 25 largest markets based on the number of sales transactions. This may be a sign that first-time homebuyers are pursuing home purchases in less expensive markets.
- The share of cash sales in the last quarter of 2016 was the highest in New York, Florida and Illinois. Four out of every 10 sales in these states did not require a mortgage. The share of cash sales was the lowest in North Dakota, Minnesota and Maine, where less than two in 10 sales did not require a mortgage.
- Three of the four markets with the highest share of cash sales are in Florida – Orlando, Fla. (35 percent); Tampa, Fla. (38 percent) and Miami (48 percent).
What Insight Does the AEI/First American National Housing Market Index Reveal?
In contrast to existing estimates of home sales, the AEI/First American NHMI is based on comprehensive loan- and transaction-level data and does not involve extrapolations from a survey or sample of the housing market. Other published data are based on surveys or samples, necessitating assumptions about the entire market. The NHMI is the only metric that compiles data from virtually the entire housing market, provides views into the data from many key perspectives, and is published with minimal time lag each quarter.
About the National Housing Market Index
The National Housing Market Index (NHMI) combines International Center on Housing Risk (ICHR) data on the federal agency market with public records data provided by First American via DataTree.com. The combined data set provides nearly complete coverage of the entire home purchase market at the national, state and metro levels. Institutional financed transactions include loans financed by Fannie Mae, Freddie Mac, FHA, VA, RHS, and the private loan market. Other financed transactions are financed by non-institutional lenders, such as seller-carried loans or loans made by private party lenders. The NHMI measures the volume of residential home sales since the fourth quarter of 2012 on a quarterly basis and is available nationally, at the state and CBSA level, as well as by transaction financing type and occupancy type. Housing market indices at the state level and for metropolitan areas are calculated using the same methodology as for the national index.
The full audio recording of the Fourth Quarter 2016 AEI/First American NHMI briefing can be found here. For more detailed information, please see the methodology here.


