House price appreciation remains on a tear, as unadjusted home prices nationwide increased by 7.3 percent compared with a year ago and are now 1.3 percent above the housing boom peak in 2006, according to DataTree by First American. The U.S. economy continues to perform well, as the current economic expansion reaches record levels, prompting some to ponder when it will end.
“We’re seeing the first indications that price appreciation may be slowing, but the underlying fundamental housing market conditions support a natural moderation of house prices rather than a sharp decline.”
It’s no secret the housing market played a central role in the last recession, so many may expect history to repeat. However, the housing market today is very different from the housing market during the previous housing boom.
What’s Different Now?
The price appreciation experienced in the housing market during the mid-2000s was characterized by a surge in demand driven by wider access to mortgage financing. Price appreciation in today’s housing market is characterized by a shortage of supply. The supply of homes on the market remains extremely low, and the homes that hit the market sell very quickly – an indication that demand is outpacing supply.
The low inventory, combined with income and employment growth, tighter mortgage underwriting, and strong economic fundamentals, fuels price appreciation that is very different than the price appreciation during the housing boom that peaked in 2006. Today, house prices are rising because of a lack of supply of homes for sale, near record low mortgage rates and the strong underlying economic fundamentals of the second longest expansion in U.S. history.
Consumer House-Buying Power Stronger Today than Previous Housing Boom Years
While unadjusted house prices are 1.3 percent above the housing market peak in 2006, consumer house-buying power has increased by 55 percent over the same time period. House-buying power, how much one can buy based on household income and the 30-year, fixed-rate mortgage, has benefited from a declining rate environment, and slow, but steady household income growth. Consumers buy homes based on how much it costs each month to make a mortgage payment, not the price of the home. Lower mortgage interest rates and growing incomes mean home buyers can afford to borrow more and buy more, which drives price appreciation.
In fact, after considering changes to household income levels and the 30-year, fixed-rate mortgage, our Real House Price Index (RHPI) shows that consumer house-buying power-adjusted house prices are 36.9 percent below their housing boom peak in July 2006 and remain 11.0 percent below the level of prices in January 2000.
Has House Price Appreciation Reached a Tipping Point?
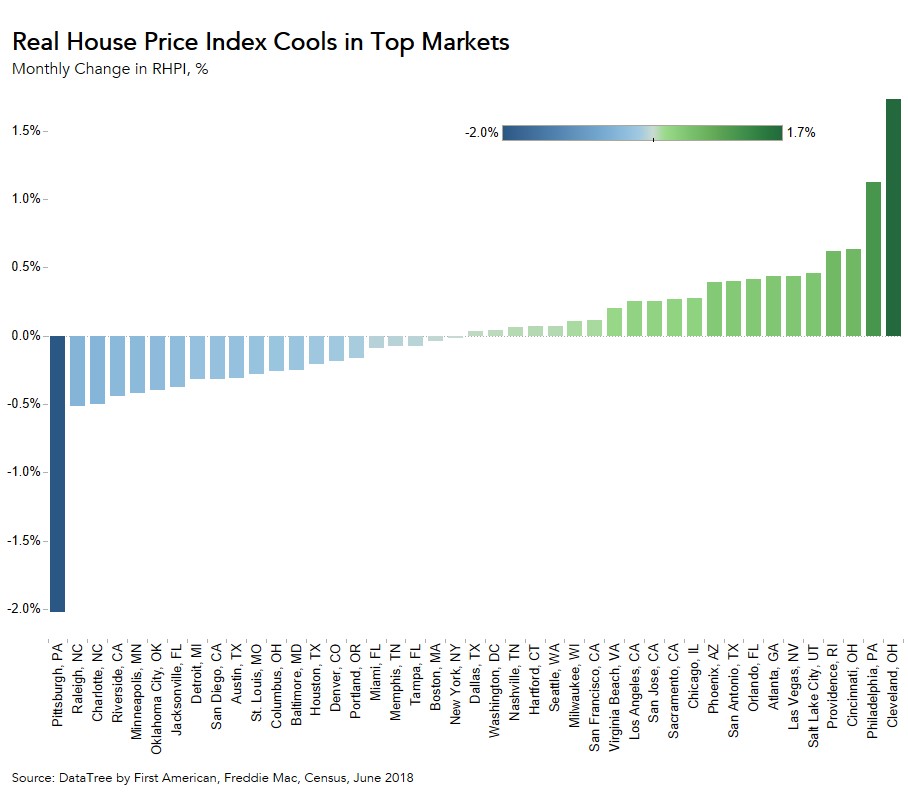
Real estate markets tend to move in cycles, but they do not always end in a housing bust. As rising prices and modestly rising mortgage rates undermine affordability and buyers struggle to find something to buy with so little for sale, it’s natural to see some moderation in price appreciation. In fact, we are already beginning to see cooling in some markets. According to our RHPI, 21 markets experienced a monthly decline in their RHPI levels in June, which is the largest number of markets to see declines since September 2017. The five cities with the greatest month-over-month decrease in their RHPI levels in June 2018 were Pittsburgh (-2.0 percent), Raleigh, N.C. (-0.5 percent), Charlotte, N.C. (-0.5 percent), Riverside, Calif. (-0.4 percent) and Minneapolis (-0.4 percent).

As buyers pull back from the market and sellers adjust their price expectations, house prices will adjust, but the strong economic conditions and the shortage of supply relative to demand continue to support the housing market. We’re seeing the first indications that price appreciation may be slowing, but the underlying fundamental housing market conditions support a natural moderation of house prices rather than a sharp decline.
For Mark’s full analysis on affordability, the top five states and markets with the greatest increases and decreases in real house prices, and more, please visit the Real House Price Index.
The RHPI is updated monthly with new data. Look for the next edition of the RHPI the week of September 24, 2018.
Data Sources:


