Aristotle said, “The worst form of inequality is to try to make unequal things equal.” While people are naturally drawn to the idea of an equal society, the truth of the matter is that it is quite rare, sometimes seemingly impossible. The question is determining when inequality has gone too far, and by what standards of measurement.
"As income inequality persists in many metropolitan areas, those who are housing-cost burdened are further excluded from the housing market."
An early 2015 study by the Brookings Institution showed income inequality to be significant among many of the largest U.S. cities. In fact, according to the study, large cities are more unequal than the overall nation, and in a few cities growing income inequality is primarily being driven by increased income gains among the rich. These income inequality trends underlie efforts in many cities to increase minimum wages, and they are fueling political debate about the impact of stagnant wages, a shrinking middle-class and declining economic mobility. We have focused on the importance of homeownership as a means to reduce economic inequality in past posts.
As in real estate, income inequality is local. National measures mask the great diversity of conditions across the country. In this post, we expand on the Brookings study by using more recent data and extending the analysis to the largest 100 metropolitan areas in the U.S. We used household level demographic Census data from Integrated Public Use Microdata Series from the Current Population Survey (IPUMS-CPS).[1] Like the Brookings study, our analysis focuses on the difference between incomes near the top of the distribution – households earning more than 95 percent of all other households – and those at the bottom of the distribution – households earning more than only 20 percent of all other households. The Brookings study and others have utilized the 95/20 ratio as a measure of income inequality. Why 95 and 20 percent? Census data typically reports income quintiles and the 95th percentile, so this ratio is mostly due to constraints of the aggregated data released, while still capturing the essence of the concept of income inequality.
Income Inequality Measures
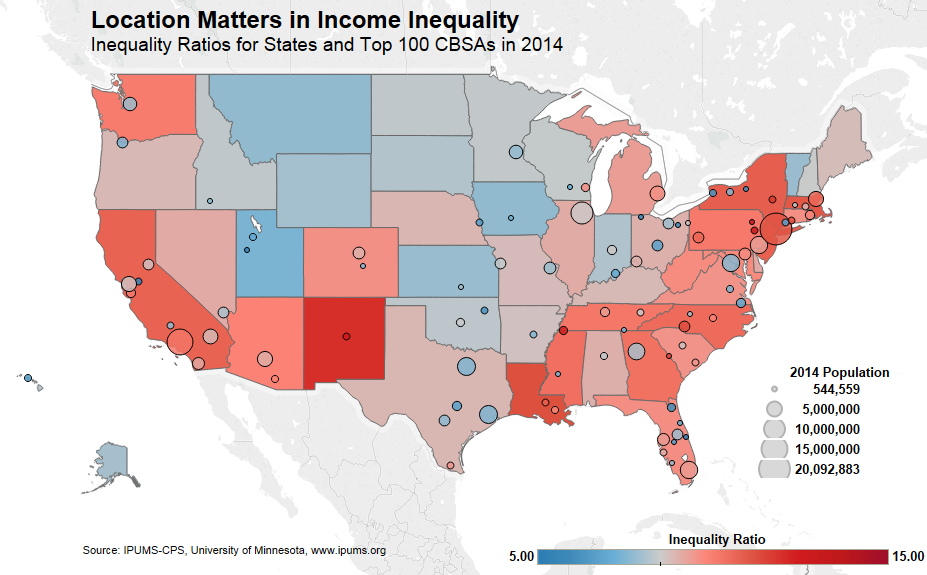
Nationally, in 2014, households in the 95th percentile of income earned 8.3 times as much income as households in the 20th percentile of income earned ($191,000 versus $23,000), an increase from a ratio of 8.0 in 2013. The map of the U.S. shows the wide range of variation in equality, particularly at the CBSA level.
The most unequal metropolitan area in 2014, with an income inequality ratio of 13.2, was Scranton-Wilkes-Barre-Hazelton, Pa.; followed by Allentown-Bethlehem-Easton, Pa.; Albuquerque, N.M.; Memphis, Tenn.; and Albany-Schenectady-Troy, N.Y. All five cities have significantly higher levels of income inequality relative to the overall nation. The least unequal large markets in the U.S. are Palm Bay-Melbourne-Titusville, Fla.; Provo-Orem, Utah; Toledo, Ohio; Stockton-Lodi, Calif.; and Akron, Ohio.
To provide scale and context, in the most egalitarian large metropolitan market, Palm Bay, households in the 95th percentile of income earned 5.1 times more income than households in the 20th percentile of income earned ($144,000 versus $28,000). In the most unequal market in the country, Scranton, the level of income inequality is almost three times higher. Households in the 95th percentile of income earned 13.4 times as much income as households in the 20th percentile of income earned ($241,000 versus $18,000) in Scranton.
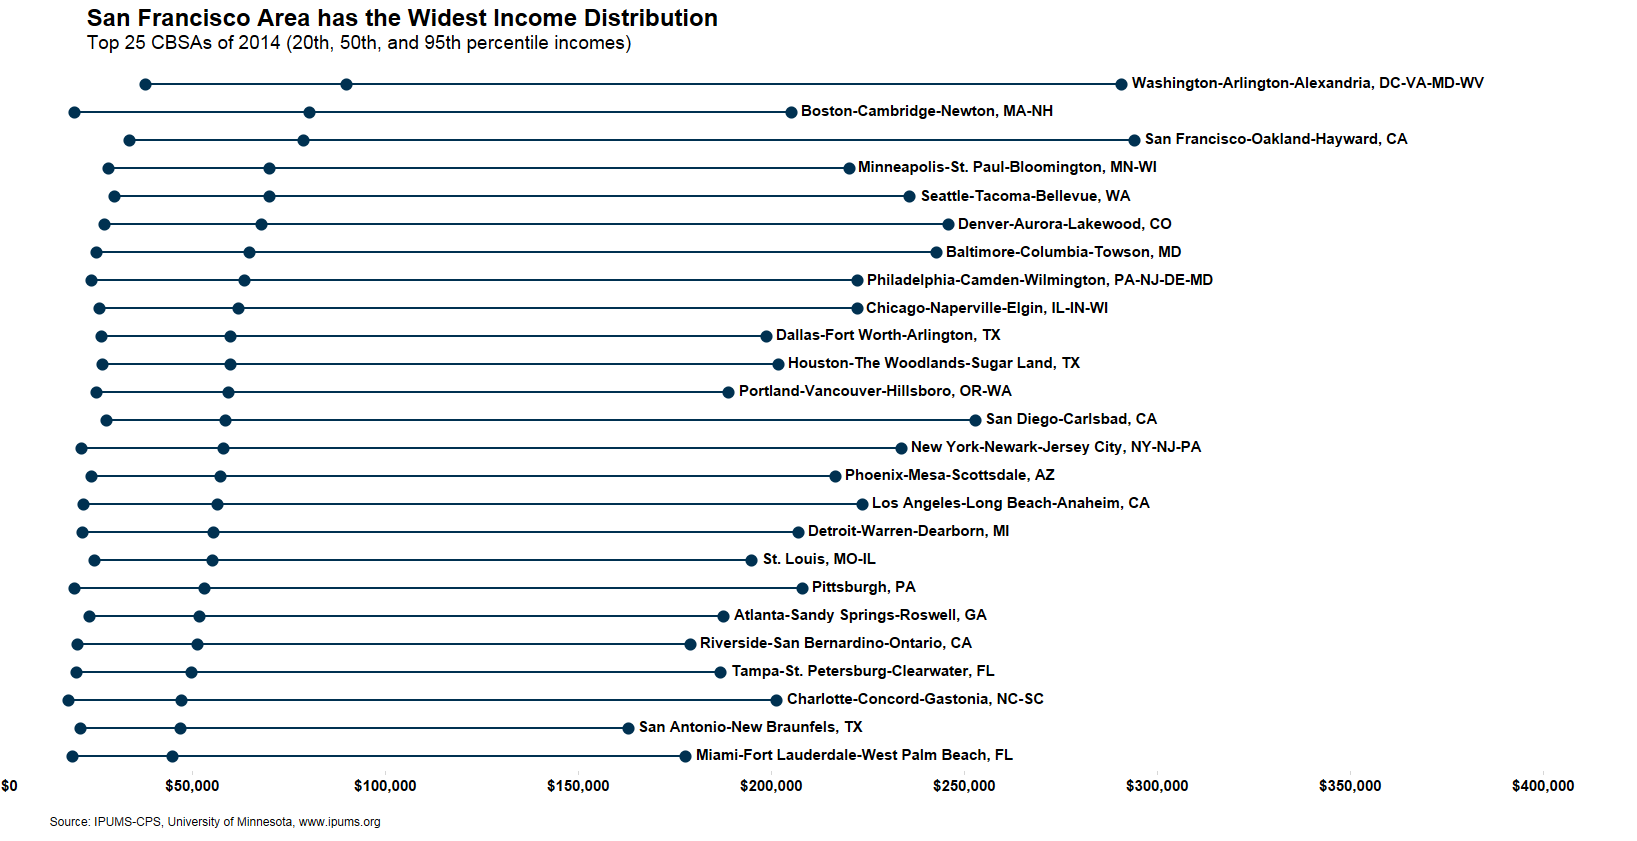
Figure 1 shows the top 25 CBSAs and the dollar amounts associated with the 95th and 20th percentile incomes. The CBSAs are sorted from highest to lowest median incomes. In this figure, San Jose-Sunnyvale-Santa Clara, CA has the widest distribution, which may lead one to believe that it is the most unequal CBSA of the top 25. The 95th percentile income in this market is $392,000, while the lower 20th percentile income is $39,000, giving it an inequality ratio of 10. The New York-Newark-Jersey City, NY-NJ-PA market is lower on the highest median income list, yet it has the greatest inequality ratio among the top 25 CBSAs, with a ratio of 10.81. The 95th percentile income in the New York CBSA is $234,000, while the 20th percentile income is 21,000. While the San Jose metropolitan area may have wealthier individuals, the New York CBSA outperforms in the inequality ratio, primarily because the 20th percentile income is almost 50 percent lower than the 20th percentile income in San Jose.
FIGURE 1
The Link Between Income Inequality and Homeownership
As might be expected, households earning high income tend to be less housing-cost burdened, which is defined as households who pay more than 30 percent of their gross income toward shelter. Housing-cost burdened, lower income households tend to struggle to accumulate any substantive savings and may face challenges buying other necessities, such as food, clothing, and medical services. The degree to which a household is housing-cost burdened causes barriers to homeownership. A study by the Board of Governors of the Federal Reserve System, based on data from 2013, finds that 81 percent of all renters wish to be owners. Of those renters making under $40,000, their primary reason for renting instead of owning is that they don’t have a down payment. Of those renters making $100,000 or more, renting is not due to any financial barrier, but because they are in transition or it is currently more convenient. For high income earners, financial barriers to homeownership may not necessarily exist at all.
In addition to the basic challenges of saving for homeownership, low-income individuals are challenged to find housing in desirable markets. A recent paper by researchers at Harvard University argues that the prohibitive cost of living in the areas with the greatest economic opportunities has forced low-wage workers to migrate to areas with inferior opportunities. The paper goes on to argue that the economy works best when people can move where their skills are most valued. But for low-skill workers, the high price of housing means the cost of living in those places often exceeds the benefits of working there. The vicious cycle of income inequality perpetuates further inequality within an area.
Whether income inequality is viewed as a ratio or in its raw income distribution form, it is clear that income inequality persists and is increasing. Some Ievel of inequality may be natural within society, but increasing income inequality, particularly for low income households, has negative effects. As income inequality persists in many metropolitan areas, those who are housing-cost burdened are further excluded from the housing market.
Odeta Kushi contributed to this blog post.
FIGURE 2
[1] IPUMS-CPS, University of Minnesota, www.ipums.org

