In this episode of the REconomy podcast from First American, Chief Economist Mark Fleming and Deputy Chief Economist Odeta Kushi explain why the key to measuring housing affordability is to determine whether a renter can afford to purchase a home, or more precisely how many homes they can afford to buy, if any.
Don’t miss a single REconomy episode, subscribe today.
Listen to the REconomy Podcast Episode 9
“We often focus on the concept of affordability as being a demand-side problem. But, in fact, affordability is also a function of supply, high house-buying power with nothing for sale, a market becomes unaffordable, because there's just not much out there. And that means the share, or the number, of homes that you could potentially choose to buy within your price range dwindles quickly.” – Mark Fleming, chief economist at First American
Transcript
Odeta: Welcome back to another episode of the REconomy podcast where we discuss economic issues that impact real estate, housing and affordability. I'm Odeta Kushi, deputy chief economist at First American. And here with me is Mark Fleming, chief economist at First American. Hi, Mark. I'm really looking forward to our conversation today.
Mark: Hi, Odeta. Me too, especially because we're going to talk about who let the genie out of the bottle.
Odeta: Okay, just to clarify, this has absolutely nothing to do with Aladdin and everything to do with the Gini coefficient, which was actually the inspiration for our most recent report. So, let's start out with what is the Gini coefficient? And, is there an easy way for people to visualize it?
Mark: Well, this is gonna be interesting on a podcast, isn't it? Since we don't have visual aids and, you know economists, we all love our visual aids. But let's give this a try. This was actually something invented by a guy named Gini, G-I-N-I – not the same as Aladdin, but yet pronounced genie – back in 1912. And it was used as a way to measure inequality of either income or wealth across countries. It also uses a concept called a Lorenz curve, also by a guy named – you know, we're really inventive in economics – Max Lorenz in 1905. And it's about trying to understand your relative ability, or earning power relative to your position in the population. So, in a perfectly equal society, everybody would have an equal share of the overall total earnings. Of course, those don't exist. And it's a measure of how unequal or equal that sort of sharing of the total pie is. It's probably something that you might want to try and Google to see a visual aid to go along with what we're about to discuss.
Odeta: I would highly recommend Googling the Lorenz curve and the Gini coefficient. But before we dig any deeper into the chart and how we're visualizing this, I think it's about time we reveal what in the world all of this has to do with housing. And in a nutshell, the Gini coefficient was actually our inspiration in developing an affordability measure for those that affordability matters the most, renters, since a homeowner is by definition, already able to afford a home – the one they own. The key to understanding housing affordability is to determine whether a renter can afford to purchase a home, or more precisely how many homes they can afford, if any. So how exactly do we do this, Mark?
Mark: I think this is really the key. It's not the traditional way that we typically think about measuring somebody's income, the median renter's income, or the median total individual's income, and saying, how does that stack up relative to the median-priced home? Doesn't really matter what the prices of the homes are, as much as it is, how many homes are out there that I can afford to buy? So, we're really going back to the basics and asking the question about affordability. By asking the question that every potential first-time home buyer asks themselves, which is, how many homes can I afford to buy? Well, then affording to buy is a function of, okay, how much can I afford to borrow and put down? And we use our house-buying power concept. That is, how much can I borrow given an income and an interest rate and a reasonable down payment. How much can I afford to buy? And then here's the Lorenz/Gini trick, if you will, where we let ourselves out of the bottle, is where we say, right, given that ability to purchase in terms of dollars, we just simply ask the question, How many? Or what are the share of homes for sale that an individual can afford to buy?
Odeta: And the renter component, and all this, and I think you mentioned it briefly in the beginning is that we're actually using the renters household income, which is very different from using a homeowner's income, which tends to be much, much higher than that of a renter. So given the information you just mentioned, is it possible that markets with the greatest house-buying power are not necessarily the most affordable?
Mark: Absolutely, I mean, just because you could be able to afford a lot of home with buying power in the millions of dollars. Don't forget, I'm going to take a small digression here something that you and I talked about yesterday. With mortgage rates so low, how much do you think you can really afford to borrow? There was an adage from the 70s and 80s. And you know how I really like the 1980s.
Odeta: Yes, I know.
Mark: An old adage from the 80s was the sort of rule of thumb was you could probably afford to borrow roughly three times your income. So, if your household income was $50,000 You can afford to borrow $150,000. And maybe a down payment would put you up to 160 or 175, for what you could afford to buy.
Odeta: I grew up with that knowledge as well.
Mark: Multiplier of three tried and true, right? But that was really predicated on a world where interest rates were at 6, 7 or 8 percent. Now that rates are 3, 3.5, even 2.5, or below 3 percent, the multiplier is not three anymore. The multiplier with rates below 3 percent? Almost eight times your income. So, all of a sudden that $50,000 of household income with an interest rate of 2.5 or 3 percent is a $400,000 mortgage, not a $150,000 mortgage. That's actually what we're seeing in the market today is, obviously, all of that buying power as you go out to look for homes to buy. Again, just because I couldn't afford to buy a $400,000 home doesn't really matter if there are no $400,000 homes for sale and everything is more expensive, or the majority of the homes are more expensive. So yes, it's absolutely possible. Huge amounts of house-buying power. Everybody has it today. But it doesn't make a market affordable.
Odeta: Right? Well, all of this house-buying power, there's a dynamic at play here, which is we have a lot more house-buying power, but that has also bid up prices. Because we have people that can afford more home, but there are not enough homes available for sale. So, prices have been going up. And so we saw in this most recent report that house-buying power nationally actually increased in the fourth quarter of 2020 by almost 10 percent. And that was really a product of super low mortgage rates in the fourth quarter, I think mortgage rates hit 2.7 percent. So very, very low. But, actually, the number of homes that people could afford actually declined. Prices went up. I think it was something like, people could afford to buy 57% of homes for sale in the fourth quarter and that was down from 61% one year ago. So even though house-buying power went up, the share of homes that people can afford went down.
Mark: This is perfect. You make a great point, because we often focus on the concept of affordability as being a demand-side problem. But, in fact, affordability is also a function of supply, high house-buying power with nothing for sale, a market becomes unaffordable, because there's just not much out there. And that means the share, or the number, of homes that you could potentially choose to buy within your price range dwindles quickly. I would call that an unaffordable market, just like one with lots of homes for sale where you can't afford to buy them. In either case, it's unaffordable. I can't find something that I can afford to buy.
Odeta: Absolutely. And speaking of markets, this analysis is done at the market level. So, we're looking at the top 50 markets in the United States. And just to have a little bit of fun here. What would you think is our most affordable market? If you had to guess, just parts of the United States? Where do you think you'd find the most affordable versus the least affordable?
Mark: I think least affordable is easy. I'd probably guess it somewhere in California.
Odeta: Yeah, you're right.
Mark: Most affordable. I'll pick somewhere in Texas, maybe Dallas or Houston. These are markets where they're building like crazy, relative to anywhere else in the country. There's less of a supply shortage there. So, I'll go with somewhere in Texas. How close am I?
Odeta: Well, you're close. You're warm. So, our most affordable market was actually Oklahoma City in the fourth quarter of 2020. The median renter, so the person making the 50th percentile, renter household income in Oklahoma City could afford 86 percent of homes for sale. So that the median house price in Oklahoma City in the fourth quarter was $184,000.
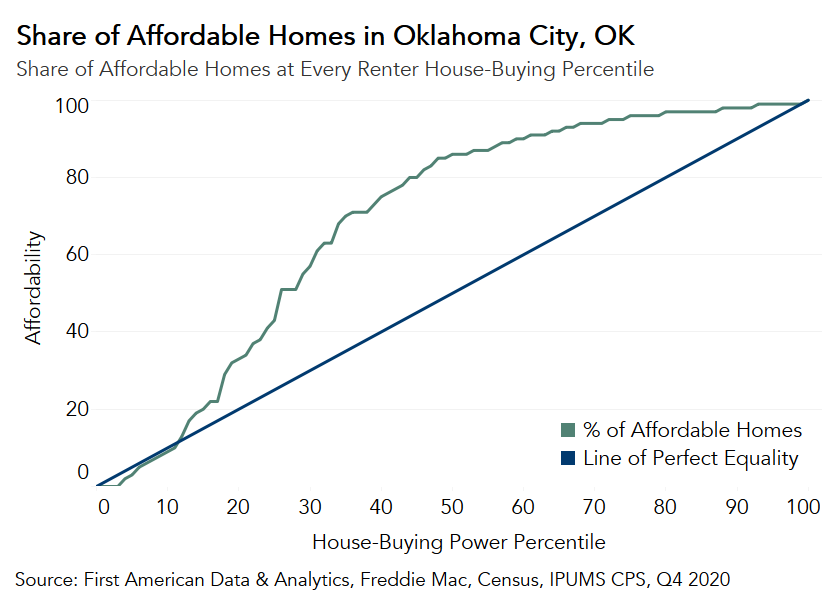
Whereas the median renter’s house-buying power was $329,000. So, that's a pretty affordable market. You are right on with your least affordable. Los Angeles is our least affordable market in the fourth quarter of 2020. The median house price was about $730,000. But, the median renters house-buying power was $370,000.
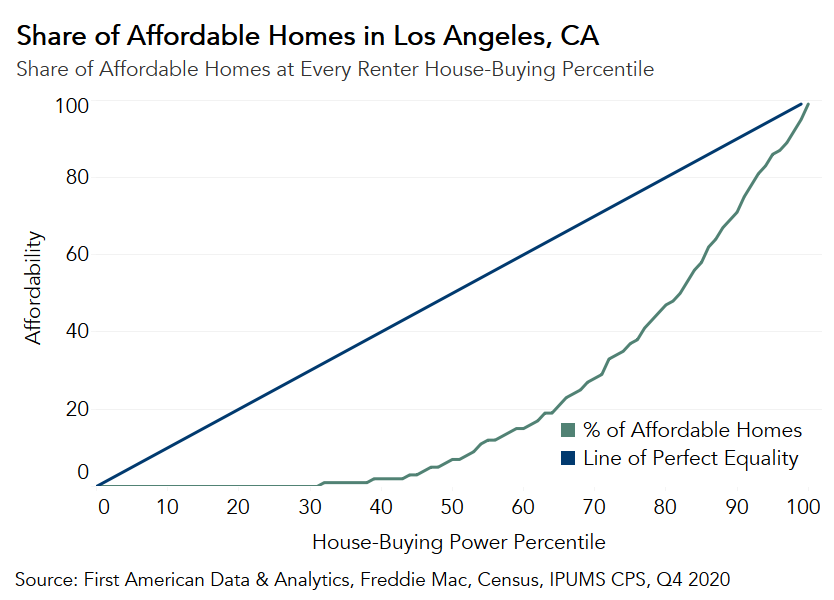
So, they could only afford 7 percent of homes for sale in Los Angeles. And you know, that's being a little bit generous. Because what do those 7th-percentile homes really look like? Are they livable? Not so sure.
Mark: I bet you'd have to put a little bit of extra cash into some of those homes to actually make them livable. So, even at that point, there's very little for that median renter or to buy, if anything at all.
Odeta: So, a very, very unaffordable market. So let's bring this back to the beginning. What does this have to do with the Gini coefficient and with Lorenz curves. And I think this is where it gets a little bit tricky because we have to describe how we're visualizing this, what this really looks like.
Mark: And so you're making me describe what it looks like. Thanks Odeta. I really appreciate that. Okay.
Odeta: I'll put up the visualization somewhere. But you can describe it.
Mark: Imagine a chart where you put on the Y-axis, the share value of homes for sale, and on the X-axis, the rental income distribution. And so the person down at the base of the chart is your zero, or first percentile of renter income. And what we want to map out is, how much of the housing stock can that person afford to buy, so you go up the Y-axis a percent, or very barely up, how much the person can afford to buy. And then you work your way along. So that 50th percentile or the median renter, that's halfway down the X-axis, and you just go and find, in your example of Oklahoma City, 87 percent on the Y-axis, so that, though, is pretty darn high up there. If it's Los Angeles that we're looking at, that is really low down on there. You can imagine a 45-degree line in whatever percentile position you are in, in the renter income distribution, exactly matches the percent share of homes you can afford to buy. The median where 50th-percentile person can afford 50 percent of the homes, the 25th-percentile person can afford 25 percent of the homes, the 75th-percentile person can afford 75 percent of the homes, that would be that 45-degree line. What we do with our Lorenz curves is map out the actual line by percentile of income to see where you are. And you can imagine this S-shaped curve, that sort of curves along usually for a little while below the 45-degree line. And the question is, how far below, and then crosses the 45-degree line and goes above. So, these S-curves lined up along the 45-degree line. The degree of equality, or inequality, is really measured by how far away that curve is from that 45-degree line. And most importantly, where do you cross it because you could argue, the 100th-percentile renter could probably afford to buy practically all the homes, and the one-percentile renter usually can afford to buy very few of the homes, but it really becomes everybody in between, what is their relative share, and the examples you gave here are perfect. There's a lot of that line below the 45-degree line, if you're in Los Angeles. And, a lot of that S-shaped curve is actually above the 45-degree line, if you're in Oklahoma City.
Odeta: Mark, you did a great job explaining it. For anyone interested, we do have all of these charts up on our data center on the Econ site. The First-Time Home Buyer Outlook Report. You can look at all these curves and you can find where you land on that curve. Check your household income, put yourself on the curve, and see how many homes in your market you can afford to buy. You might be surprised, again, we talked about mortgage rates and the power that mortgage rates have in boosting affordability and if there's something out there in your price range for you to buy. So, you heard it here. Home prices alone do not make or break affordability. It's all about the share of homes for sale that are within the renter’s house-buying power. So, thanks for joining us on this episode of the REconomy podcast. Be sure to subscribe on Apple, Google, Spotify or your favorite podcast platform. You can also sign up for our blog at Firstam.com/economics. And if you can't wait for the next episode, follow us on Twitter @OdetaKushi for me and @MFlemingEcon for Mark. Until next time.


