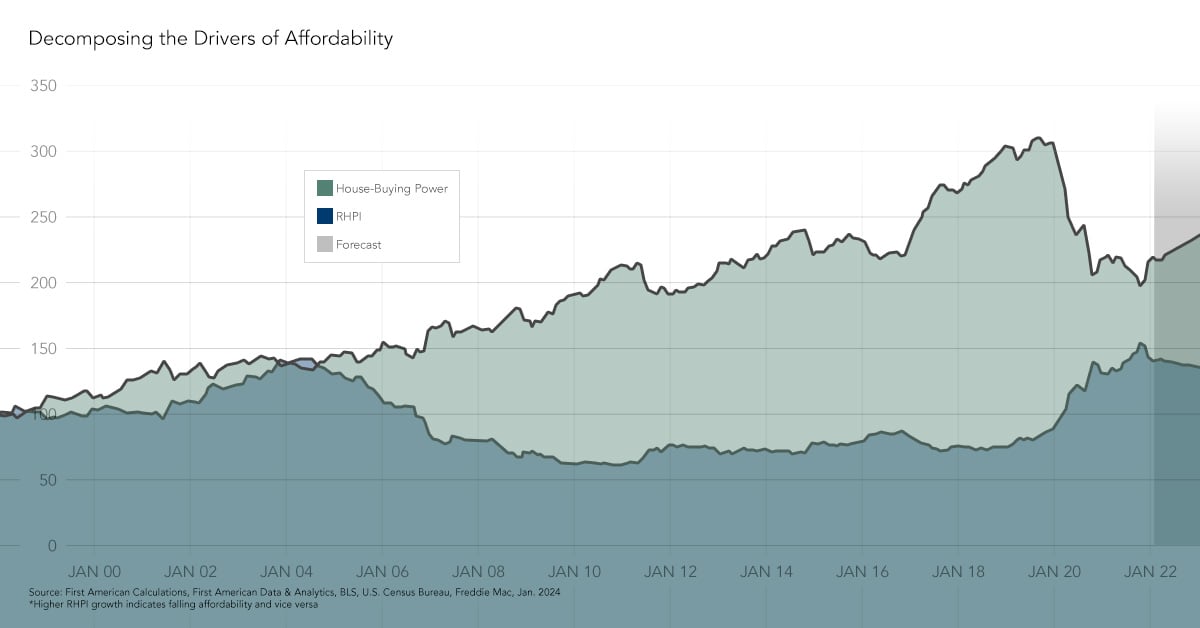
Affordability continued its rapid decline in August 2022, as the Real House Price Index (RHPI) soared 49 percent on an annual basis. The ongoing and swift decline in affordability was driven by a 15 percent increase in nominal house prices and a 2.4 percentage point increase in the 30-year, fixed mortgage rate compared with one year ago. As affordability wanes, would-be buyers are pulling back from the market, prompting annual house price appreciation to fall from its recent peak. Nationally, annual house price growth peaked in March at nearly 21 percent but has since fallen by approximately 6 percentage points to 15 percent in August. Nominal house price appreciation is poised to fall further as the hot sellers’ market of early 2022 turns in favor of buyers.
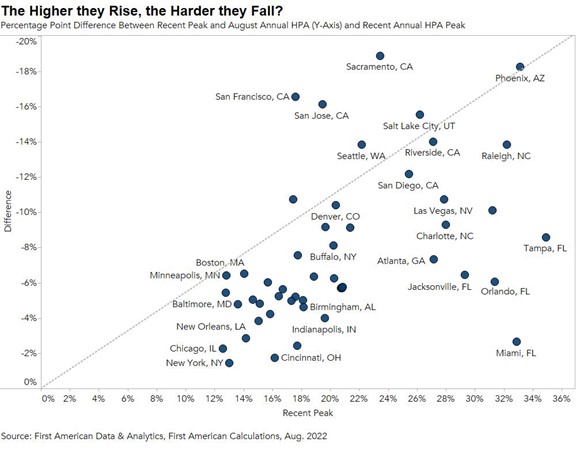
"House price appreciation has slowed in all 50 markets we track, but the deceleration is generally more dramatic in areas that experienced the strongest peak appreciation rates."
For home buyers, the loss of affordability caused by a higher mortgage rate can be mitigated with an equivalent, if not greater, increase in household income or by choosing an adjustable-rate mortgage (ARM), which typically has a lower rate than a 30-year, fixed-rate mortgage. Even though higher household income and ARMs help to increase consumer house-buying power, they’re not enough to offset the affordability loss from higher rates and fast-rising nominal prices.
Double-digit national house price growth was not sustainable in the long run, so what went up so quickly, must eventually come down. But real estate is local, so it’s important to analyze how the deceleration in house prices varies by market.
Peak Price Appreciation to Present
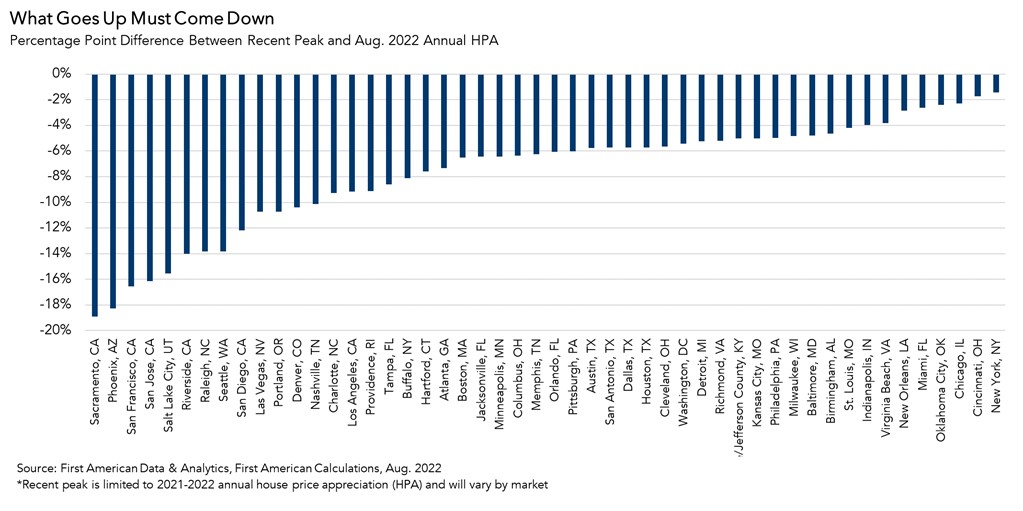
While house price appreciation in all top 50 markets has slowed from recent peaks, some markets’ growth rates have cooled faster than others. The chart below shows the difference between the 2021 or 2022 peak of annual house price appreciation and the August 2022 level for each respective market. The markets are rank ordered from the largest to the smallest percentage point difference.
For example, the market with the strongest deceleration was Sacramento, Calif. Annual house price appreciation in Sacramento peaked in July 2021 at 23.5 percent, but has since slowed to 4.6 percent, a 19-percentage point difference. The market with the smallest difference was New York. In New York, house price appreciation reached 13 percent on an annual basis at its peak in May 2021 and was just over one percentage point less at 11.6 percent in August 2022. The market with the slowest annual pace of appreciation in August was San Francisco at 1.1 percent, down significantly from its July 2021 pace of 17.6 percent. However, some markets continue to see strong house price growth. The market with the fastest pace of appreciation in August was Miami at 30 percent, which is only 3 percentage points below its peak of 33 percent in May of 2021.
Pandemic-Era Sellers' Market Fading
House price appreciation has slowed in all 50 markets we track, but the deceleration is generally more dramatic in areas that experienced the strongest peak appreciation rates. However, price appreciation has proven more resilient in parts of Florida. Miami, Tampa, Orlando, and Jacksonville had peak house price growth rates near or above 30 percent, but their fall from peak has not been as severe as in other markets.
While house prices historically have been resistant or slow to decline, a dynamic referred to as ‘downside sticky,’ the recent decline in affordability has forced sellers to adjust their price expectations. Homeowners have to resist the recency bias of the hot 2021 market and adjust to a market where buyers are facing mortgage rates approaching 7 percent. As a result, it’s no surprise that price cuts are becoming more common.
Slowing price appreciation is expected to continue as the housing market adjusts to the decline in affordability and the pandemic-era sellers’ market turns in favor of buyers. Double-digit house price growth was not sustainable in the long run, so what went up so quickly, is now coming down. However, don’t expect a housing bust like the mid-2000s, as lending standards in this housing cycle have been much tighter and homeowners have historically high levels of home equity, so there likely won’t be a surge in foreclosures.
For more analysis of affordability, please visit the Real House Price Index. The RHPI is updated monthly with new data. Look for the next edition of the RHPI the week of November 28, 2022.
Sources:
August 2022 Real House Price Index Highlights
The First American Real House Price Index (RHPI) showed that in August 2022:
- Real house prices decreased 1.8 percent between July 2022 and August 2022.
- Real house prices increased 49.0 percent between August 2021 and August 2022.
- Consumer house-buying power, how much one can buy based on changes in income and interest rates, increased 2.5 percent between July 2022 and August 2022, and decreased 22.8 percent year over year.
- Median household income has increased 2.9 percent since August 2021 and 76.5 percent since January 2000.
- Real house prices are 25.8 percent more expensive than in January 2000.
- While unadjusted house prices are now 55.4 percent above the housing boom peak in 2006, real, house-buying power-adjusted house prices remain 11.2 percent below their 2006 housing boom peak.
- The five states with the greatest year-over-year increase in the RHPI are: Florida (+65.4), Georgia (+55.6), South Carolina (+53.5 percent), North Carolina (+52.7 percent), and Connecticut (+52.3 percent).
- There were no states with a year-over-year decrease in the RHPI.
August 2022 Real House Price Local Market Highlights
- Among the Core Based Statistical Areas (CBSAs) tracked by First American, the five markets with the greatest year-over-year increase in the RHPI are: Miami (+66.7 percent), Tampa, Fla. (+60.6 percent), Raleigh, N.C. (+58.0), Indianapolis (+57.8 percent), and Orlando (+57.8 percent).
- Among the Core Based Statistical Areas (CBSAs) tracked by First American, there were no markets with a year-over-year decrease in the RHPI.
About the First American Real House Price Index
The traditional perspective on house prices is fixated on the actual prices and the changes in those prices, which overlooks what matters to potential buyers - their purchasing power, or how much they can afford to buy. First American’s proprietary Real House Price Index (RHPI) adjusts prices for purchasing power by considering how income levels and interest rates influence the amount one can borrow.
The RHPI uses a weighted repeat-sales house price index that measures the price movements of single-family residential properties by time and across geographies, adjusted for the influence of income and interest rate changes on consumer house-buying power. The index is set to equal 100 in January 2000. Changing incomes and interest rates either increase or decrease consumer house-buying power. When incomes rise and mortgage rates fall, consumer house-buying power increases, acting as a deflator of increases in the house price level. For example, if the house price index increases by three percent, but the combination of rising incomes and falling mortgage rates increase consumer buying power over the same period by two percent, then the Real House Price index only increases by 1 percent. The Real House Price Index reflects changes in house prices, but also accounts for changes in consumer house-buying power.
Disclaimer
Opinions, estimates, forecasts and other views contained in this page are those of First American’s Chief Economist, do not necessarily represent the views of First American or its management, should not be construed as indicating First American’s business prospects or expected results, and are subject to change without notice. Although the First American Economics team attempts to provide reliable, useful information, it does not guarantee that the information is accurate, current or suitable for any particular purpose. © 2022 by First American. Information from this page may be used with proper attribution.