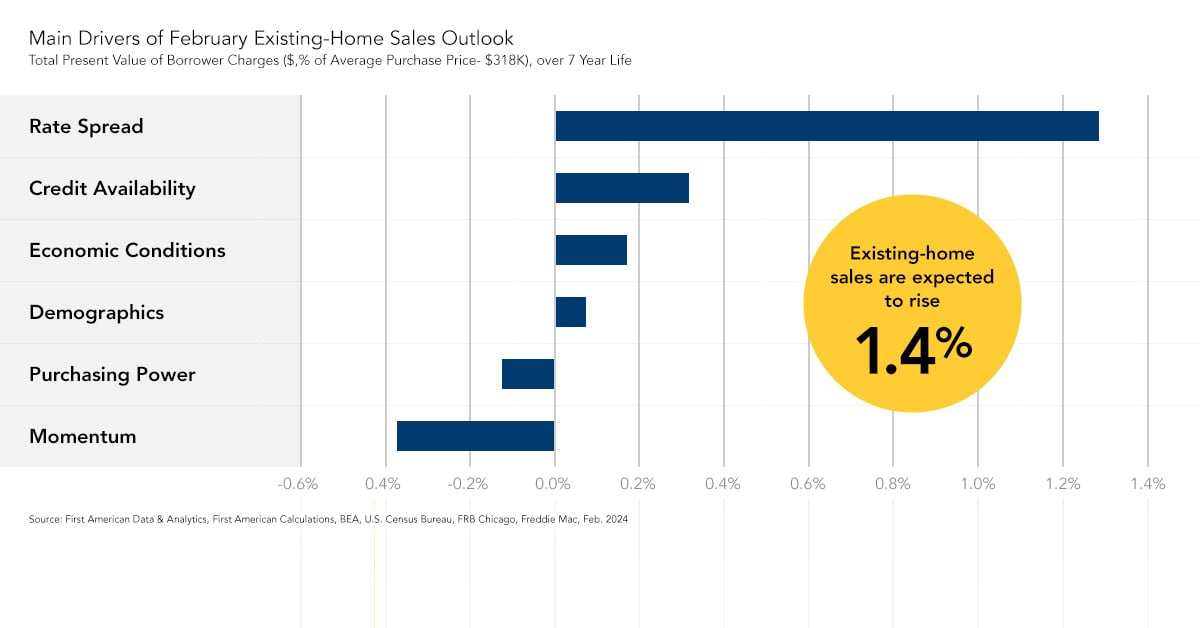
The final month of 2019 saw actual existing-home sales exceed housing market potential by 1.2 percent, or an estimated 64,830 seasonally adjusted annualized sales. According to our Potential Home Sales Model, housing market potential increased 1.7 percent in December 2019 relative to the previous month, and grew 2.6 percent year over year, an increase of 134,460 potential existing-home sales.
The Duality of Low Mortgage Rates
The growth in the market potential for existing-home sales is the net result of several forces that either boost or bash housing market potential. However, one market driver is actually both a positive and a negative influence on housing market potential – persistently low mortgage rates.
“Lower rates boost housing market potential, but also discourage homeowners from selling and increase tenure length, thus reducing the supply of existing homes for sale – this is the duality of low mortgage rates.”
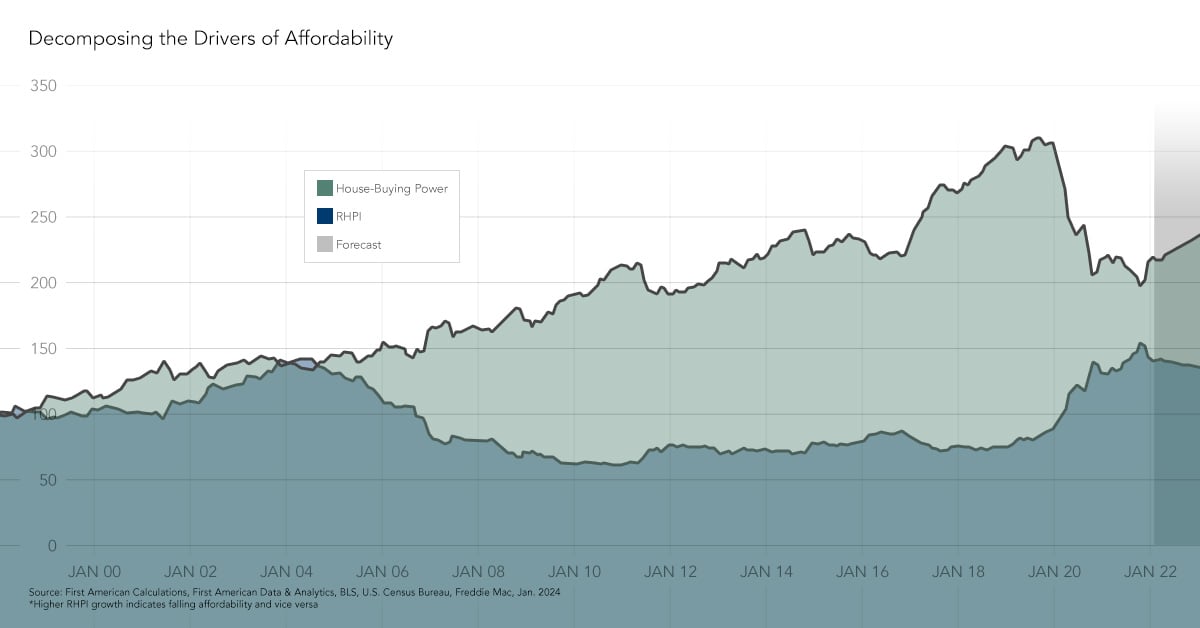
Lower Rates Boost Affordability
In December 2019, the primary driver of rising housing market potential compared with one year ago was increased house-buying power, how much home one can afford to buy given household income and the prevailing mortgage rate. House-buying power was 12.5 percent higher than a year ago. This increase in house-buying power had the greatest impact on housing market potential in 2019, boosting market potential by 316,000 potential home sales.
The house-buying power surge was driven by the combined impact of lower mortgage rates, which were 0.92 percent lower in December than they were a year ago, and a 2.4 percent increase in annual household income. Clearly, lower mortgage rates result in considerable affordability gains for potential home buyers, which boost home-buying demand and, in turn, market potential.
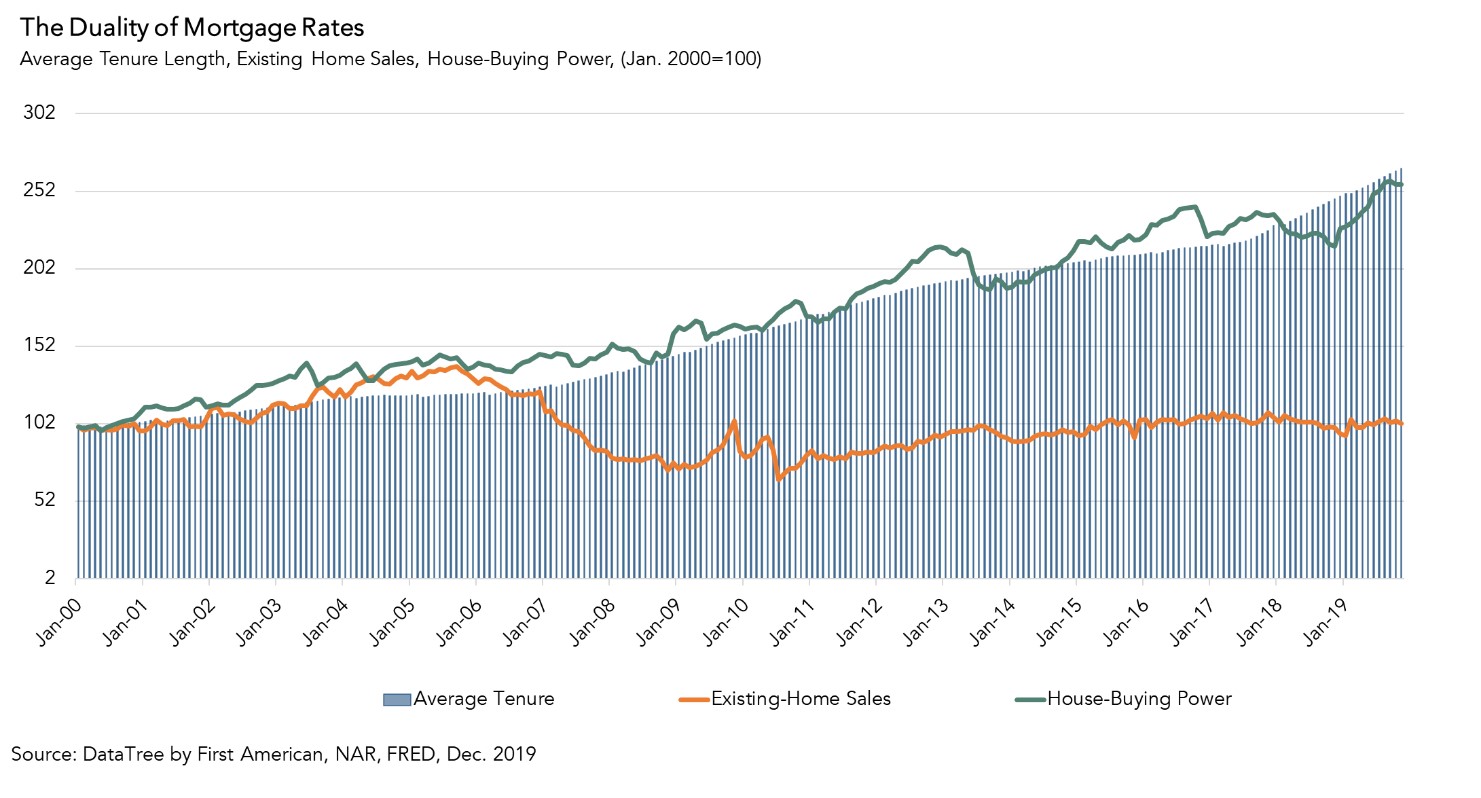
Persistently Low Rates Increase Tenure Length, Reduce Supply
Falling mortgage rates can help incentivize homeowners to sell their home and purchase a different home, but persistently low mortgage rates can have the opposite effect. The decades-long decline in the 30-year, fixed mortgage rate, dropping from a high of 18 percent in 1981 to a low of nearly 3 percent in 2012, to just below 4 percent today, has helped prod the housing market. This long-run decline increased affordability and encouraged existing homeowners to move.
However, the 30-year fixed-rate mortgage has hovered below 5 percent since the end of the Great Recession – nearly a decade ago! While historically low rates increase buying power and make it more affordable for potential buyers to purchase a home, they also discourage many existing homeowners from selling. There is little to no house-buying power benefit for homeowners with an already low mortgage rate, so the only way existing homeowners can increase their house-buying power is through household income growth. This helps explain why more and more homeowners have decided to “stay put,” reducing the inventory of homes for sale.
As a result, tenure length (how long one stays in a home between moves) has increased dramatically. Prior to the recession, tenure length was less than six years on average. In December 2019, tenure length approached 12 years, up 8 percent compared with one year ago. According to our analysis, lower rates boost housing market potential, but also discourage homeowners from selling and increase tenure length, thus reducing the supply of existing homes for sale – this is the duality of low mortgage rates.
What Does This Mean For 2020?
Consensus among forecasters is that mortgage rates will remain below 4 percent for the next two years. Low mortgage rates and increased house-buying power will continue to boost demand, as will demographic tailwinds from millennials entering their prime home-buying years. On the other hand, those persistently low rates will discourage existing homeowners from selling, pushing up tenure length and limiting the inventory of homes available for sale. However, that doesn’t necessarily mean we should expect housing market potential to decline. There are many considerations that go into one’s housing tenure decision, which could result in the desire to move. The lack of housing supply has been the norm for several years, yet the housing market has endured.
December 2019 Potential Home Sales
For the month of December, First American updated its proprietary Potential Home Sales Model to show that:
- Potential existing-home sales increased to a 5.30 million seasonally adjusted annualized rate (SAAR), a 1.7 percent month-over-month increase.
- This represents a 57.8 percent increase from the market potential low point reached in February 1993.
- The market potential for existing-home sales increased by 2.6 percent compared with a year ago, a gain of 134,460 (SAAR) sales.
- Currently, potential existing-home sales is 1.43 million (SAAR), or 21.3 percent below the pre-recession peak of market potential, which occurred in March 2004.
Market Performance Gap
- The market for existing-home sales outperformed its potential by 1.2 percent or an estimated 64,830 (SAAR) sales.
- The market performance gap decreased by an estimated 44,610 (SAAR) sales between November 2019 and December 2019.
First American Deputy Chief Economist Odeta Kushi contributed to this post.
What Insight Does the Potential Home Sales Model Reveal?
When considering the right time to buy or sell a home, an important factor in the decision should be the market’s overall health, which is largely a function of supply and demand. Knowing how close the market is to a healthy level of activity can help consumers determine if it is a good time to buy or sell, and what might happen to the market in the future. That is difficult to assess when looking at the number of homes sold at a particular point in time without understanding the health of the market at that time. Historical context is critically important. Our potential home sales model measures what we believe a healthy market level of home sales should be based on the economic, demographic and housing market environments.
About the Potential Home Sales Model
Potential home sales measures existing-homes sales, which include single-family homes, townhomes, condominiums and co-ops on a seasonally adjusted annualized rate based on the historical relationship between existing-home sales and U.S. population demographic data, homeowner tenure, house-buying power in the U.S. economy, price trends in the U.S. housing market, and conditions in the financial market. When the actual level of existing-home sales are significantly above potential home sales, the pace of turnover is not supported by market fundamentals and there is an increased likelihood of a market correction. Conversely, seasonally adjusted, annualized rates of actual existing-home sales below the level of potential existing-home sales indicate market turnover is underperforming the rate fundamentally supported by the current conditions. Actual seasonally adjusted annualized existing-home sales may exceed or fall short of the potential rate of sales for a variety of reasons, including non-traditional market conditions, policy constraints and market participant behavior. Recent potential home sale estimates are subject to revision to reflect the most up-to-date information available on the economy, housing market and financial conditions. The Potential Home Sales model is published prior to the National Association of Realtors’ Existing-Home Sales report each month.